
Fig. 25. Optimal ranges identified for all targets using the FF2-6-001 qPCR set-up tool TestPlateResultsAnalysis2006.xls file (which is connected by Visual Basic macros and equations to its "twin" file, TestPlateResultsAnalysis2006b.xls, which is used to fine-tune the parameters revealed by this file).
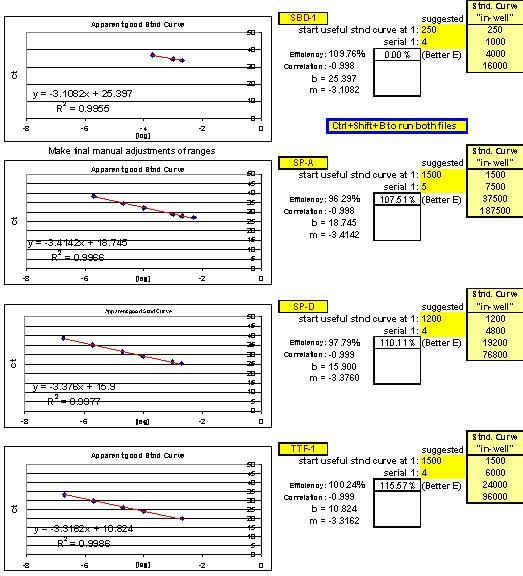
Efficiencies and slopes for each target are calculated from Test Plate CT values for each qPCR target as the user manually selects different points on each graph in effort to ascertain the optimal RNA dilution ranges for each target.