
Fig. 2.
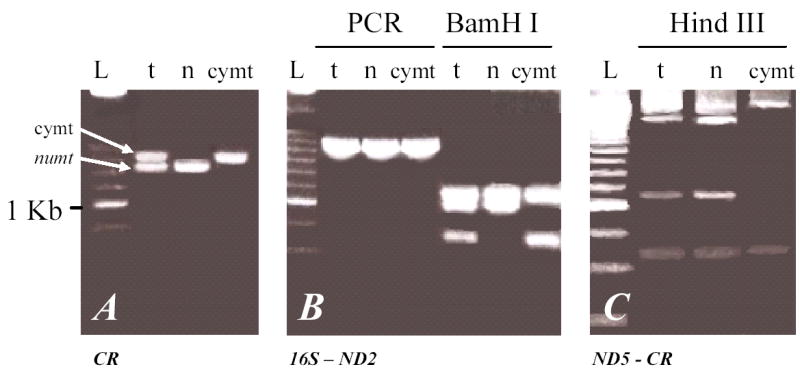
Differences in the banding patterns from PCR products amplified from total (t), nuclear (n), and cytosolic mitocondrial (cymt) Panthera DNA fractions from two of the four segments surveyed that showed presence of numt copies. The two segments represented in this figure were chosen for depiction due to the clear distinction of numt sequences caused by the large deletions in CR and 16S. The banding patterns observed were similar in all Panthera species and thus only a single species profile is represented. (A) Control region fragment. (B) Region between 16S and ND2 gene followed by restriction enzyme digestion of BamH I. Lane L represents DNA size ladder 250 (BRL, i.e. the brightest band is 1.0 kb and each step represents 250 bp).