
Figure 1.
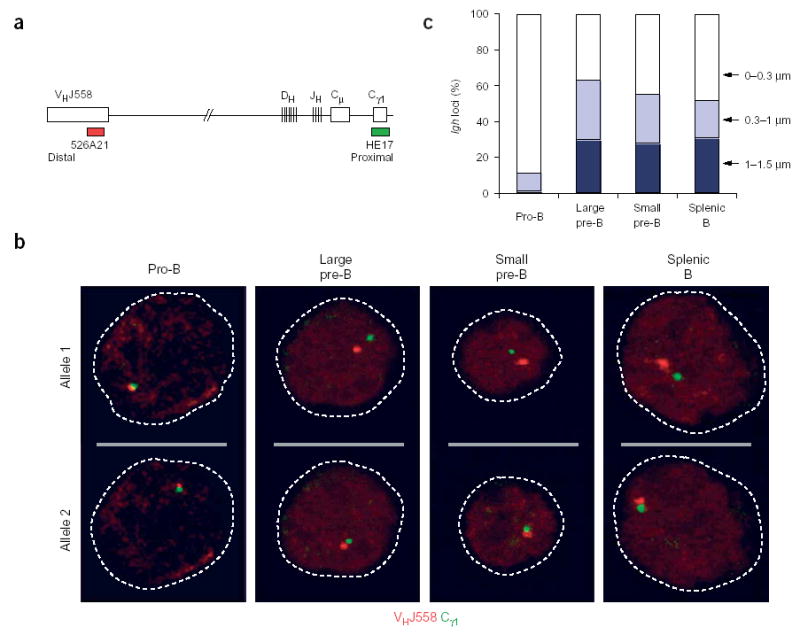
Decontraction of the Igh locus in large pre–B cells. (a) Igh locus (not drawn to scale), indicating the positions of bacterial artificial chromosome (BAC) 526A21 (ref. 12) and plasmid HE17 (ref. 24), which were used to generate the VHJ558 (red) and Cγ1 (green) probes, respectively. (b) Representative confocal sections through the nuclei of B lymphocytes at various developmental stages (above images) in which three-dimensional DNA FISH analysis of the Igh locus was done with VHJ558 (red) and Cγ1 (green) probes. The two Igh alleles of each cell are presented on separate optical sections. Broken lines outline the contours of the nuclei. Pre–B cells were identified as large or small cells under the microscope. (c) Separation of VHJ558 and Cγ1 gene segments. The distance (in μm) separating the VHJ558 and Cγ1 segments was evaluated statistically for B lymphocytes of various developmental stages (horizontal axis). Actual numbers and sample sizes are in Supplementary Table 1 online.