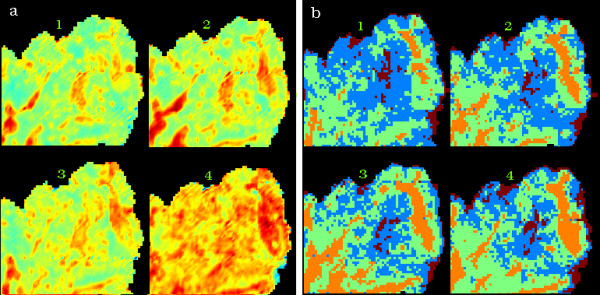
Figure 3.

Hyper-spectral FTIR data processing performed simultaneously on 4 adjacent tissue sections from a cervical biopsy sample. The numbers 1 through 4 identify the individual sections in the figure. In (a), a univariate chemical image obtained from the integrating the area under the 1275-1190 cm-1 region after baseline subtraction and in (b), a 4 cluster map derived from analysis over the 1272-950 cm-1 spectral window. The cluster map false color scheme corresponds to brown for exudates, blue for inflamed glandular tissue, green for connective tissue and orange for blood filled capillaries as described in the text.
