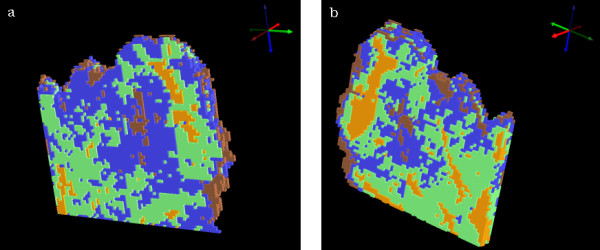
Figure 6.

Two views of 3D cluster maps for 4 clusters obtained from analysis in the 1272-950 cm-1 spectral region. The cluster map false colors are as described in the caption of figure 3 (b). The view is looking toward the section 1 side of the sampled volume in (a) and towards the section 4 side in (b).
