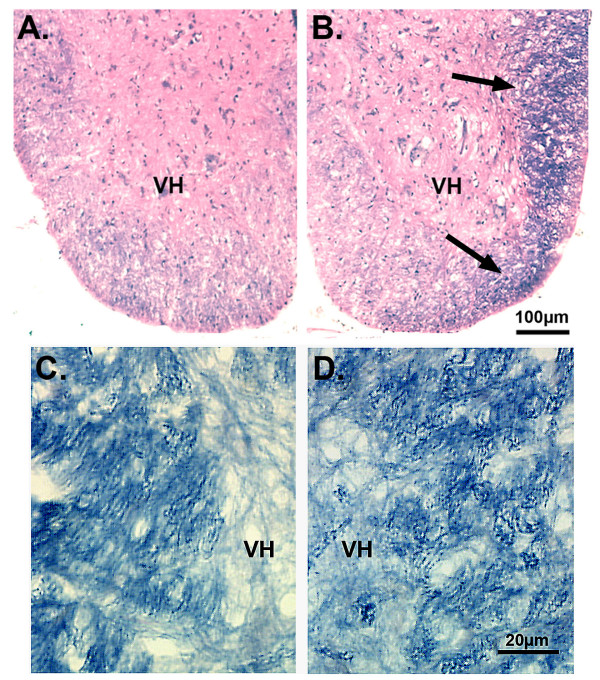
Figure 2.
Low power photomicrograph of hematoxylin & eosin (A, B) and cyanin R (C, D) stained sections through the lumbar spinal cord. Left panels (A, C): Spinal cord of a peptide-treated rat that was symptom-free showing limited small cell infusion and myelin degeneration. Right panels (B, D): Spinal cord of a vehicle treated rat that had an EAE score of 2.0. The tissue was characterized by EAE lesions consisting of small darkly staining cells in the ventral and lateral white matter (arrows), and myelin degeneration as shown in an adjacent section (D).

