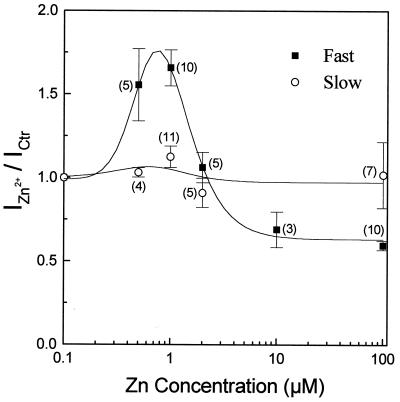
Figure 4.
Dose-related Zn2+ modulation on glycine responses. The fast (peak) component of glycine (■) and the slow (sustained) component (○) responses were plotted against zinc concentration. Each data point represented the mean ± SE from multiple cells. The number near each data point indicates the number of cells tested at that concentration.

