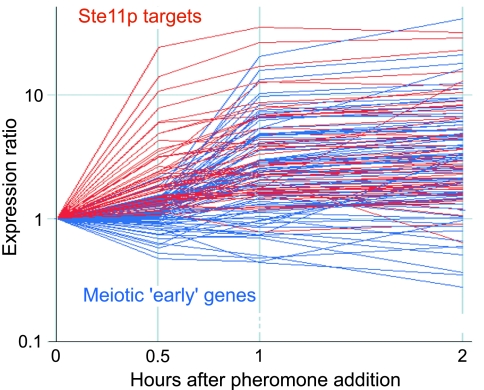
Fig. 5.
Induction of gene expression after pheromone addition. Time course experiment after expression levels of Ste11p target genes (red) and meiotic early genes (blue; ref. 8) up to 2 h after addition of pheromone (P factor). The y axis shows the expression ratio of mRNA levels at each time point relative to the levels before addition of pheromone.

