Abstract
Proteins, the workhorses of living systems, are constructed from chains of amino acids, which are synthesized in the cell based on the instructions of the genetic code and then folded into working proteins. The time for folding varies from microseconds to hours. What controls the folding rate is hotly debated. We postulate here that folding has the same temperature dependence as the α-fluctuations in the bulk solvent but is much slower. We call this behavior slaving. Slaving has been observed in folded proteins: Large-scale protein motions follow the solvent fluctuations with rate coefficient kα but can be slower by a large factor. Slowing occurs because large-scale motions proceed in many small steps, each determined by kα. If conformational motions of folded proteins are slaved, so a fortiori must be the motions during folding. The unfolded protein makes a Brownian walk in the conformational space to the folded structure, with each step controlled by kα. Because the number of conformational substates in the unfolded protein is extremely large, the folding rate coefficient, kf, is much smaller than kα. The slaving model implies that the activation enthalpy of folding is dominated by the solvent, whereas the number of steps nf = kα/kf is controlled by the number of accessible substates in the unfolded protein and the solvent. Proteins, however, undergo not only α- but also β-fluctuations. These additional fluctuations are local protein motions that are essentially independent of the bulk solvent fluctuations and may be relevant at late stages of folding.
Keywords: folding energy landscape, fractional viscosity dependence, internal viscosity, Maxwell relation, protein–solvent interaction
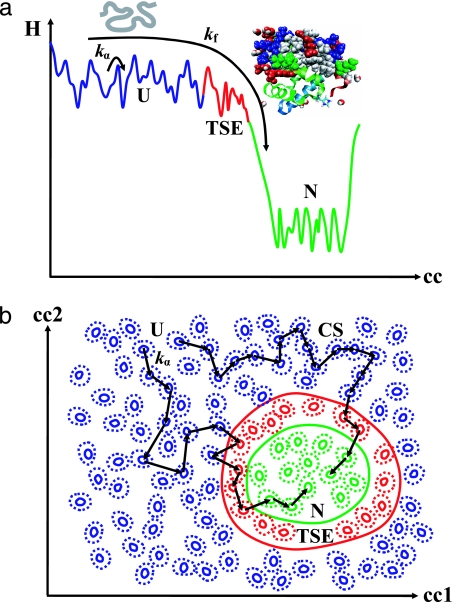
Proteins in cells fold and unfold continuously. Consequently, an understanding of folding rates is key. The distribution and strength of contacts in the native state is one ingredient that influences the rate of folding (1). A second ingredient is the effect of the solvent, because protein motions are intimately linked to the motions of the environment. Our slaving model quantifies the linkage. The model is based on three concepts: Proteins assume a large number of different conformations or substates (2), their organization is described by a hierarchic energy landscape (3), and large-scale protein fluctuations follow the α-relaxation (Debye or dielectric relaxation) in the bulk solvent (4–6). Here we propose that these concepts also are valid for folding and that they lead to the model pictured in Fig. 1. Fig. 1a is a cartoon of folding and a 1D cross-section through the high-dimensional energy landscape. Fig. 1b is a 2D cross-section. Each valley in this landscape represents a conformational substate of the unfolded protein ensemble (U), the transition state ensemble (TSE), and the native ensemble (N). An unfolded protein starts out in U and makes a random walk in U until it reaches the TSE. Each step in this walk can occur only if the solvent moves and, hence, its rate is proportional to the rate coefficient kα(T) of the α-relaxation. Once in the TSE, the protein either returns to U or falls into the folding funnel that leads to N (7–11). Fig. 1a is, however, misleading because it suggests that there is only one pathway for folding. The 2D cross-section in Fig. 1b shows that there are many pathways and that the density of substates can differ in different parts of the landscape. A dense region in U can act as an intermediate state. Proteins with dissimilar structures have been found to have the same folding activation enthalpy (12, 13). The slaving model explains the similar activation enthalpies as being dominated by kα(T). Although proteins may possess some internal viscosity (14, 15), the slaving model does not require internal protein dissipation to explain the data. Thus, internal viscosity must be a negligibly small effect in existing experiments.
Fig. 1.
A schematic description of protein folding. In real space, the unfolded polypeptide (U) folds into the working protein (N). In conformational space, the protein makes a random walk through the high-dimensional energy landscape. (a) A 1D cross-section through the energy landscape showing the U (blue), TSE (red), and N (green) conformational basins. The long arrow represents a folding path with an overall rate kf, whereas the short arrow shows a single step, with a rate kα, in the conformational diffusion during folding. (b) A 2D cross-section through the energy landscape illustrating two different paths for the folding motions of proteins. Starting from a U conformation, proteins make a Brownian walk in the conformational space until they finally fall into the ensemble of N substates.
Slaving in the Native Protein
Before treating the effect of the solvent on protein folding, we discuss some aspects of the dynamics of the protein in the native state. Consider the rate coefficient, kexit(T), for the exit of CO or O2 from myoglobin (Mb) embedded in a glycerol/water solvent (4–6). Because Mb does not have static channels, the exit of ligands must involve conformational fluctuations, which are controlled by the α-fluctuations in the solvent: kexit(T) parallels kα(T) over almost six orders of magnitude but is slower by nearly five orders of magnitude (5). Slowing occurs because large-scale protein motions are not due to a single large fluctuation but are the result of a large number, nexit, of elementary steps. Each step can only take place if the solvent moves. The rate coefficient kexit(T) is therefore given by
The coefficient c is included because it may take somewhat more or less than one solvent fluctuation to induce a step. We take c = 1 for simplicity. If nexit(T) is temperature-independent, the enthalpic barrier governing the ligand exit is entirely due to the solvent. If the conformational random walk occurs on a sloping energy landscape or if an enthalpic protein barrier HP is present, nexit(T) depends on temperature and is given by
where R is the gas constant and ns is the solvent-dependent number of steps if HP = 0. In the language of transition state theory, ln ns = S‡/R, where S‡ is the activation entropy. Measurements of kexit(T) and kα(T) yield the parameters HP and ns. Although the concept of slaving was introduced based on experiments (5), the theoretical understanding of slaving is from Lubchenko and Wolynes (4) and is based on the physics of glass-forming liquids. Glass-forming liquids have a dynamic mosaic structure described by the Random First-Order Transition theory. Applied to slaving, the theory not only describes how the molecular motions of the solvent distort the boundaries of the protein but also gives the length and time scales of the solvent-imposed constraints.
Protein folding and large-scale motions of folded proteins are related; they correspond to random walks on the global energy landscape while the protein is embedded in a solvent. It is therefore reasonable to postulate that folding, like ligand escape, is slaved to the solvent and proceeds in a large number of steps, nf. In the slaving model, Eq. 2 also applies to folding. To test the model, kf(T) and kα(T) should be measured in the same solvent. We have not found such data. However, many folding rates have been determined as a function of the solvent viscosity η(T), which is related to kα(T) by the Maxwell relation (16):
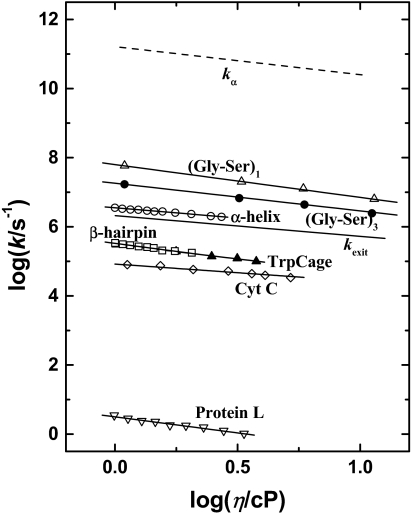
where G0 is the shear modulus. At 300 K glycerol–water mixtures have G0 ≈ 4 × 10¹¹ cP·s−1. G0 varies only weakly with solvent composition and temperature, providing usable values of kα(T) from η(T). The Maxwell relation can therefore be used to approximately test Eq. 2 for folding when kα is not known. Fig. 2 presents kf(η) for a few proteins together with kα(η) for glycerol–water solvents. The data exhibit two outstanding features: (i) The coefficients kf of all proteins are much smaller than kα, consistent with the slaving model in which a large number of steps, nf, slows protein motions relative to 1/kα. For some proteins, kf follows 1/η, whereas others show a fractional viscosity dependence (e.g., refs. 14, 15, and 17–21):
Fig. 2.
The folding rates for various polypeptides and proteins versus the solvent viscosity: (Gly-Ser)n (n = 1 and 3) polypeptide chains (17) (from Eq. 4, κ = 0.95 and 0.80, respectively), tryptophan cage (21) (κ = 0.84), cytochrome c (14, 15) (κ = 0.55), α-helix (κ = 0.53), β-hairpin (18) (κ = 0.93), and protein L (19) (κ = 0.93). The rate coefficients for the bulk α-fluctuations for glycerol–water mixtures (kα) and for kexit also are plotted for comparison.
Consider first the case in which kf(η) ∝ 1/η. Assuming G0 to be constant, Eqs. 2 and 3 substituted into Eq. 4 gives kf(η) ∝ kα and HP = 0, implying that folding is slaved and that the control of folding is largely entropic and given by the solvent. The overdamped Kramers equation (22) leads to the same conclusion but does not determine nf.
Fractional Viscosity Dependence of Protein Motions
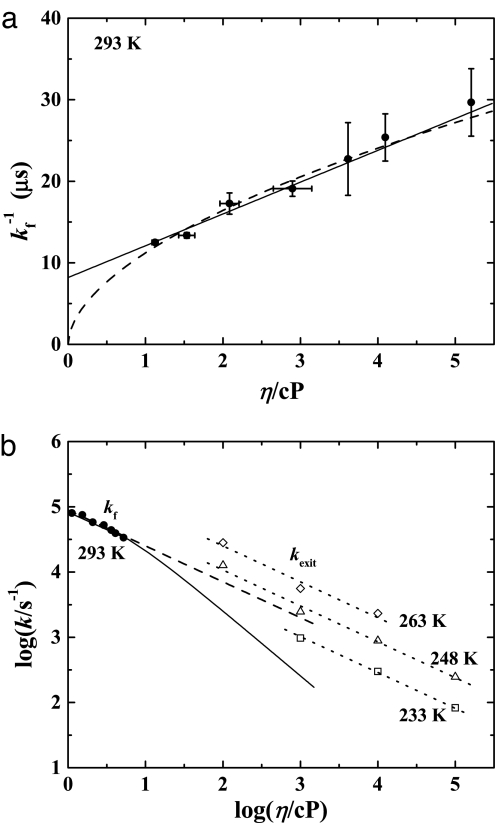
The rate coefficients kf in many folding experiments do not follow the overdamped Kramers law and deviate from the expected 1/η dependence. An example is shown in Fig. 3a, where kf−1 is plotted as a function of viscosity at 293 K (14, 15). The data up to 5 cP can be fit equally well with a linear fit and a power law, Eq. 4 with κ = 0.55. The linear fit implies an internal protein viscosity, and the power-law fit calls for an explanation of the fractional viscosity dependence. Which model is correct? Flash photolysis experiments in Mb break the deadlock because dynamic data as a function of temperature (5) and viscosity (23) are available. The experiments start with CO bound to the heme iron in Mb. A laser flash breaks the Fe–CO bond, CO escapes into the solvent, and the escape rate coefficient kexit is measured as functions of T in different solvents. Fig. 3b shows the rate coefficients for folding and for CO exit as function of logη. The isothermal data in Fig. 3b demonstrate that kexit(η) follows Eq. 4 with κ = 0.55. Also shown in Fig. 3b is kf taken from Fig. 3a. The linear (Fig. 3b, solid line) and the power-law (Fig. 3b, dashed line) fits diverge above 10 cP. Because the power-law fits for kf and kexit give the same coefficient κ ≈ 0.55 and because folding and ligand escape both involve large-scale protein motions, the data favor the slaving model. We consequently propose that the power-law fit to the isothermal data is the better description of the viscosity data and that the protein's internal viscosity is not relevant.
Fig. 3.
The viscosity dependence of large-scale protein motions. (a) Viscosity dependence of the folding time at 293 K for cytochrome c (14, 15). The solid line is a linear fit predicting an internal friction within the protein (14, 15), and the dashed line is a fit to Eq. 4 for a power-law viscosity dependence of folding, with κ = 0.55. Error bars are the standard deviation. (b) Plot of the isothermal rate coefficients versus viscosity. The dotted lines are the rates for the exit of CO from Mb (kexit) at the indicated temperatures; the solid and dashed lines are the folding rates (kf) corresponding to the linear (solid line) and power-law (dashed line) fits in a, respectively.
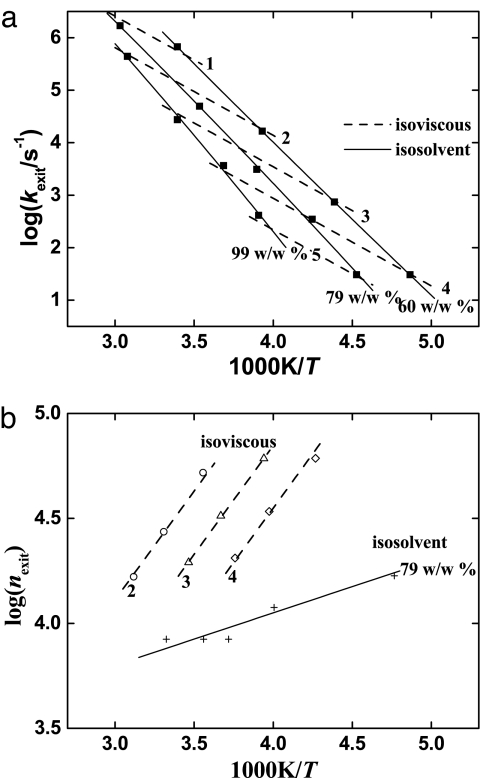
The data in Fig. 3 raise another question: What causes the fractional viscosity dependence of kexit and kf? The information from protein dynamics studies provides insight. There are three main ways to look at kexit and kf, isosolvent, isoviscous, and isothermal. The isosolvent and isoviscous data are in Fig. 4a, and the isothermal data are in Fig. 3b. In the isosolvent approach (Fig. 4a, solid lines) kexit(T) is measured in a given solvent. Evaluating the data with Eq. 2 gives log ns ≈ 3 and HP ≈ 5 kJ/mol. Thus, CO needs ≈103 steps and has to overcome a small enthalpic barrier to escape. Fig. 4b shows that ns is temperature-independent if measured in the same solvent. A surprise comes from looking at the isoviscous data in Fig. 4a and b: kexit(T) follows an Arrhenius law with Hexit ≈ 33 kJ/mol. This value creates a puzzle. Eq. 3, with G0 constant, states that kα and 1/η must have the same temperature dependence. The activation enthalpy in isoviscous solvents should therefore be given by HP, apart from a correction for the solvent-dependence of G0. The slopes of log nexit versus 1/T should therefore be the same for isoviscous and isosolvent data: HP for the isoviscous data should not be as large as 33 kJ/mol. Fig. 4b shows, however, that the isoviscous curves have a much larger slope than the isosolvent one. The large activation enthalpy of kexit and the steep increase of nexit and, therefore, of ns, with 1/T in isoviscous solvents must be due to changing entropy. As pointed out earlier, ln ns is essentially the activation entropy. Isosolvent data are strikingly different, with ns constant, apart from the small effect of HP. What causes the different behavior of isosolvent and isoviscous experiments? The answer lies in an experimental requirement.
Fig. 4.
The exit of CO from Mb (23). (a) Arrhenius plot of the CO exit rate. The symbols are the experimental data (23), the solid lines connect the data points measured in different glycerol–water mixtures [99% (wt/wt), 79% (wt/wt), and 60% (wt/wt)], and the dashed lines are the Arrhenius fits to the isoviscous data for five viscosities [log(η/cP) = 1, 2, 3, 4, and 5]. (b) Arrhenius plot of nexit. The solid line shows the data for the 79% (wt/wt) mixture, and the dashed lines show the data for three of the viscosities.
To measure kexit(T) at fixed viscosity requires a different solvent at each temperature. Different solvents can interact differently with the protein and its hydration shell and can change the dynamic and static properties and, in particular, the stability (19, 20, 24–29). Fig. 4b shows that the number of steps required for CO to escape at constant viscosity increases with decreasing temperature. The data also demonstrate that nexit at constant temperature increases with decreasing viscosity. In either case, the increase in nexit is caused by a decrease in the viscogen concentration. Thus, nexit is largest and kexit is smallest in the fully hydrated protein. The conclusion is consistent with experiments by Yedgar and coworkers (26). The temperature dependence of folding from the collapsed state of cytochrome c at constant viscosity also supports the arguments given here. Measured from 290 to 303 K, kf(T) has an apparent activation enthalpy of ≈30 kJ/mol at constant viscosity (15, 21). Most or all of the apparent activation enthalpy is due to the effect of the solvent on the protein. Solvent–protein interaction also is responsible for the power-law dependence in Eq. 4. Present experiments in the literature have not been thorough enough to determine under what conditions κ might be constant between different proteins or protein processes.
The Slaving Model and Folding
Folding involves large-scale motions and takes place in solvents of different compositions and viscosities. The arguments discussed for ligand escape therefore also apply to folding, in particular to “two-state” folders (30). The shape of the energy landscape in Fig. 1 is important. In one extreme, the main part of the energy landscape is flat and large, and the protein stays in U for a long time before it finds the TSE and falls into one of the many substates of N. In the other extreme, the folding funnel extends to the entire region U, and the protein folds fast. It is difficult to get information about the shape of the folding landscape with experiments that monitor many proteins simultaneously. Consider as an example a landscape with many substates in U and few in the transition state ensemble. Fluctuations in the length-of-stay in U may then fake a broad TSE. Single-molecule experiments provide unique insight into the energy landscape (31). One impressive example is a study by Haran and collaborators (32): Based on previous work by Eaton and collaborators (33), they studied the cold shock protein CspTm in a solution adjusted so that the folded and unfolded state were equally populated. Protein and solvent were encapsulated in a surface-tethered vesicle so that the same protein could be observed many times. Folding and unfolding were then measured by using the Förster resonance energy transfer technique. The experiment shows that the protein stays approximately the same time (≈1 s) in U and N but that the transitions between U and N take <10−4 s. This result provides a peek into the energy landscape: U and N, surprisingly, contain about the same number of substates, but the protein spends little time in the TSE. The observation that U and N are nearly equally populated provides more evidence that folded proteins are not in a unique state, as is often stated, but can assume a very large number of conformational substates. Hagen et al. (15) have made the observation that there seems to be a “speed limit” near 106 s-1. This also implies some minimum number of steps nf for protein folding. Such a lower limit for nf, if it exists, may be a measure of hydration shell entropy.
We have so far concentrated the discussion on the effect of the solvent on the folding process. This effect is dominated by the α-fluctuations. Proteins and solvents, however, also undergo β-fluctuations (6), which involve local motions, but we have so far not found direct evidence for their influence on folding. It is likely, however, that β-fluctuations also are important for many features of folding, for instance, the expulsion of water molecules and reorientation of side chains in the final stages of folding. More experiments are needed to explore the role of the β-fluctuations.
The slaving model solves some old problems but produces new ones. We mention just a few: How do solvents change nf, the number of steps in the conformational space? How do solvents affect the hydration shell? Why is there a systematic connection between viscosity and n as the solvent is varied? How are folding and protein dynamics affected by crowding in cells (34)? Because protein function involves folding and unfolding, the answers to these questions should lead to a better understanding of how proteins work in the biological environment.
Acknowledgments
We thank Joel Berendzen, Leslie Chavez, Brian Dyer, Martin Gruebele, Peter Hänggi, Martin Karplus, Thomas Kiefhaber, Albert Migliori, John Portman, Peter Wolynes, and Robert Young for discussions, suggestions, and positive criticism. This work was supported by U.S. Department of Energy Contract W-7405-ENG-36 and the Laboratory Directed Research and Development program at Los Alamos National Laboratory.
Abbreviations
- Mb
myoglobin
- N
native ensemble
- U
unfolded ensemble
- TSE
transition state ensemble.
Footnotes
The authors declare no conflict of interest.
References
- 1.Munoz V, Eaton WA. Proc Natl Acad Sci USA. 1999;96:11311–11316. doi: 10.1073/pnas.96.20.11311. [DOI] [PMC free article] [PubMed] [Google Scholar]
- 2.Austin RH, Beeson KW, Eisenstein L, Frauenfelder H, Gunsalus IC. Biochemistry. 1975;14:5355–5373. doi: 10.1021/bi00695a021. [DOI] [PubMed] [Google Scholar]
- 3.Frauenfelder H, Sligar SC, Wolynes PG. Science. 1991;254:1598–1603. doi: 10.1126/science.1749933. [DOI] [PubMed] [Google Scholar]
- 4.Lubchenko V, Wolynes PG, Frauenfelder H. J Phys Chem B. 2005;109:7488–7499. doi: 10.1021/jp045205z. [DOI] [PubMed] [Google Scholar]
- 5.Fenimore PW, Frauenfelder H, McMahon BH, Parak FG. Proc Natl Acad Sci USA. 2002;99:16047–16051. doi: 10.1073/pnas.212637899. [DOI] [PMC free article] [PubMed] [Google Scholar]
- 6.Fenimore PW, Frauenfelder H, McMahon BH, Young RD. Proc Natl Acad Sci USA. 2004;101:14408–14413. doi: 10.1073/pnas.0405573101. [DOI] [PMC free article] [PubMed] [Google Scholar]
- 7.Onuchic JN, Luthey-Schulten Z, Wolynes PG. Annu Rev Phys Chem. 1997;48:545–600. doi: 10.1146/annurev.physchem.48.1.545. [DOI] [PubMed] [Google Scholar]
- 8.Portman JJ, Takada S, Wolynes PG. J Chem Phys. 2001;114:5069–5081. [Google Scholar]
- 9.Wolynes PG. Philos Trans R Soc London A. 2005;363:453–467. doi: 10.1098/rsta.2004.1502. [DOI] [PubMed] [Google Scholar]
- 10.Gruebele M. C R Soc Biol. 2005;328:701–712. doi: 10.1016/j.crvi.2005.02.007. [DOI] [PubMed] [Google Scholar]
- 11.Roder H, Maki K, Cheng H. Chem Rev. 2006;106:1836–1861. doi: 10.1021/cr040430y. [DOI] [PMC free article] [PubMed] [Google Scholar]
- 12.Tan YJ, Oliveberg M, Fersht AR. J Mol Biol. 1996;264:377–389. doi: 10.1006/jmbi.1996.0647. [DOI] [PubMed] [Google Scholar]
- 13.Scalley ML, Baker D. Proc Natl Acad Sci USA. 1997;94:10636–10640. doi: 10.1073/pnas.94.20.10636. [DOI] [PMC free article] [PubMed] [Google Scholar]
- 14.Pabit SA, Roder H, Hagen SJ. Biochemistry. 2004;43:12532–12538. doi: 10.1021/bi048822m. [DOI] [PubMed] [Google Scholar]
- 15.Hagen SJ, Qiu LL, Pabit SA. J Phys Condens Matter. 2005;17:S1503–S1514. [Google Scholar]
- 16.Frenkel J. Kinetic Theory of Liquids. New York: Dover; 1955. [Google Scholar]
- 17.Bieri O, Wirz J, Hellrung B, Schutkowski M, Drewell M, Kiefhaber T. Proc Natl Acad Sci USA. 1999;96:9597–9601. doi: 10.1073/pnas.96.17.9597. [DOI] [PMC free article] [PubMed] [Google Scholar]
- 18.Jas GS, Eaton WA, Hofrichter J. J Phys Chem B. 2001;105:261–272. [Google Scholar]
- 19.Plaxco KW, Baker D. Proc Natl Acad Sci USA. 1998;95:13591–13596. doi: 10.1073/pnas.95.23.13591. [DOI] [PMC free article] [PubMed] [Google Scholar]
- 20.Möglich A, Krieger F, Kiefhaber T. J Mol Biol. 2005;345:153–162. doi: 10.1016/j.jmb.2004.10.036. [DOI] [PubMed] [Google Scholar]
- 21.Qiu LL, Hagen SJ. Chem Phys. 2004;307:243–249. [Google Scholar]
- 22.Hänggi P, Talkner P, Borkovec M. Rev Mod Phys. 1990;62:251–341. [Google Scholar]
- 23.Beece D, Eisenstein L, Frauenfelder H, Good D, Marden MC, Reinisch L, Reynolds AH, Sorensen LB, Yue KT. Biochemistry. 1980;23:5147–5157. doi: 10.1021/bi00564a001. [DOI] [PubMed] [Google Scholar]
- 24.Careri G. Prog Biophys Mol Biol. 1998;70:223–249. doi: 10.1016/s0079-6107(98)00030-3. [DOI] [PubMed] [Google Scholar]
- 25.Herberhold H, Royer CA, Winter R. Biochemistry. 2004;43:3336–3345. doi: 10.1021/bi036106z. [DOI] [PubMed] [Google Scholar]
- 26.Yedgar S, Tetreau C, Gavish B, Lavalette D. Biophys J. 1995;68:665–670. doi: 10.1016/S0006-3495(95)80227-4. [DOI] [PMC free article] [PubMed] [Google Scholar]
- 27.Shimizu S, Smith DJ. J Chem Phys. 2004;121:1148–1154. doi: 10.1063/1.1759615. [DOI] [PubMed] [Google Scholar]
- 28.Rösgen J, Pettitt MB, Bolen DW. Biophys J. 2005;89:2988–2997. doi: 10.1529/biophysj.105.067330. [DOI] [PMC free article] [PubMed] [Google Scholar]
- 29.Mitra L, Smolin N, Ravindra R, Royer C, Winter R. Phys Chem Chem Phys. 2006;8:1249–1265. doi: 10.1039/b516608j. [DOI] [PubMed] [Google Scholar]
- 30.Akmal A, Munoz V. Proteins. 2004;57:142–152. doi: 10.1002/prot.20172. [DOI] [PubMed] [Google Scholar]
- 31.Haran G. J Phys Condens Matter. 2003;15:R1291–R1317. [Google Scholar]
- 32.Rhoades E, Cohen M, Schuler B, Haran G. J Am Chem Soc. 2004;126:14686–14687. doi: 10.1021/ja046209k. [DOI] [PubMed] [Google Scholar]
- 33.Schuler B, Lipman E, Eaton WA. Nature. 2002;419:1233–1235. doi: 10.1038/nature01060. [DOI] [PubMed] [Google Scholar]
- 34.Ellis RJ, Minton AP. Nature. 2003;425:27–28. doi: 10.1038/425027a. [DOI] [PubMed] [Google Scholar]


