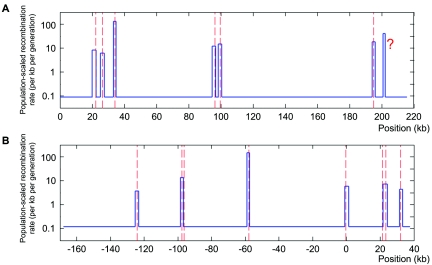
Figure 2. .
Hotspot detection in the two genomic regions where sperm-typing data are available. The blue lines are the recombination surface we estimated, and peaks in the line are recombination hotspots detected. The centers of true hotspots are shown by red dashed lines. A, The 216-kb segment of the class II region of the MHC. From left to right, the true hotspots are DNA1, DNA2, DNA3, DMB1, DMB2, and TAP2, and the question mark (?) indicates the hotspot that was not observed in sperm-typing experiments but that was conjectured by Jeffreys et al.3 and predicted computationally.28,29 These hotspots were all detected with our method, in the following order TAP2 (LLR=141.4), DNA3 (LLR=137.2), DMB2 (LLR=99.5), DMB1 (LLR=67.6), DNA2 (LLR=43.6), DNA1 (LLR=30.9), and “?” (LLR=29.3). B, The 206-kb segment on chromosome 1. From left to right, the true hotspots are NID3, NID2a, NID2b, NID1, MS32, MSTM1a, MSTM1b, and MSTM2.5 We detected six of them, in the following order: NID1 (LLR=77.0), NID2a (LLR=75.3), MSTM2 (LLR=58.4), MS32 (LLR=41.5), MSTM1b (LLR=36.4), and NID3 (LLR=30.1). In both groups of data, every hotspot we detected contains the center of its corresponding true hotspot.

