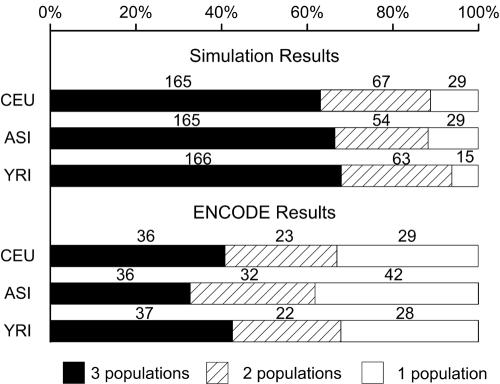
Figure 3. .
Numbers of hotspots detected in one, two, or all three populations in the simulation study and in the HapMap ENCODE data. The lengths of bars show the percentage of the hotspots in all detected hotspots, and the numbers on the bars are the numbers of hotspots following the corresponding categories. (The numbers of hotspots detected in all three populations are not the same for all populations, since there might be two hotspots in one populations overlapping with single hotspots in other populations.) It can be observed that, in the HapMap ENCODE data, we detected significantly smaller proportion of hotspots shared by all three populations but a larger proportion of hotspots that are detected only in one population, compared with those detected in the simulation data.

