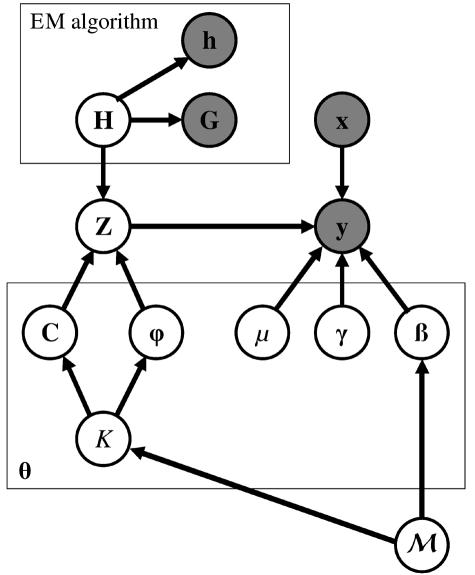
Figure 1. .
DAG representing the model underlying the likelihood,  , given by equation (3). The gray nodes represent observed data and estimated relative haplotype frequencies, obtained via implementation of the EM algorithm. The likelihood depends on a number of model parameters, θ—including the baseline risk of disease (μ), covariate-regression coefficients (γ), and genetic effects (β)—of causative variants at the functional polymorphism(s). To evaluate the likelihood, I allow for the correlation between marker-SNP haplotypes (H) and genotypes (Z) at the functional polymorphism(s), by means of a Bayesian partition model. The model is parameterized in terms of the number of clusters of haplotypes (K), the cluster centers (C), and the probability (φ) that haplotypes within each cluster carry a causative variant at the functional polymorphism(s). The parameters, θ, depend on the underlying model of association (ℳ) of disease with marker SNPs. Under the null model, M0, the genetic effects are zero, and there is a single cluster of haplotypes. Under the alternative model of association, M1, I allow for dominance effects of the causative variants at the functional polymorphism(s), and there are at least two clusters in the partition of haplotypes.

