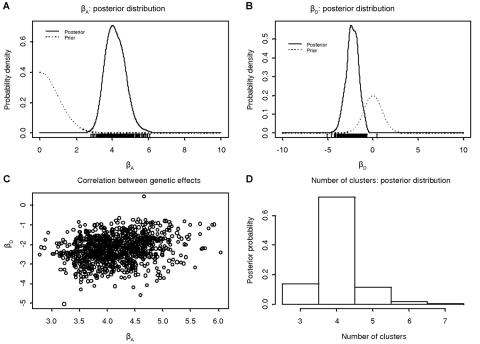
Figure 2. .
Summary of the output of a single run of the MCMC algorithm under the general alternative model of association with the PDM phenotype for 32 marker SNPs across an 890-kb region flanking the CYP2D6 gene. A, Prior and posterior distribution of additive effects of causal variants. B, Prior and posterior distribution of dominance effects of causal variants. C, Correlation between the posterior distribution of additive and dominance effects of the causal variants. D, Posterior distribution of the number of clusters of haplotypes.

