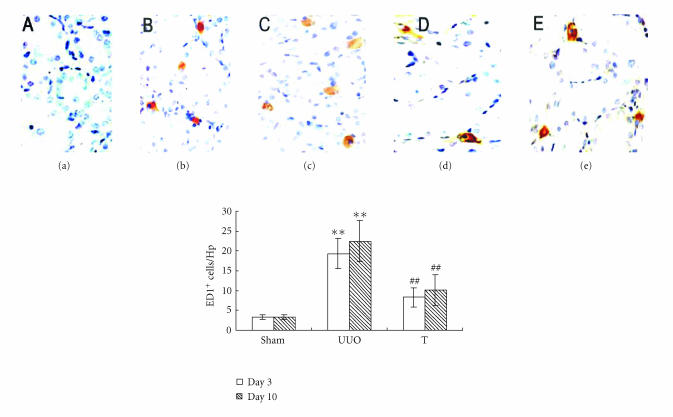
Figure 1.
ED1+ cell accumulation at different time points in three groups (×400). Sections were stained using a standard three-layer method as recommended by SP kit. Macrophage accumulation was measured by immunohistochemistry and quantified by the number of ED1+ cells/HP: (a) sham group, (b) UUO on day 3, (c) UUO on day 10, (d) treatment group on day 3, and (e) treatment group on day 10. **: P < .01 versus sham group of the same time point. ##: P < .01 versus UUO group of the same time point.

