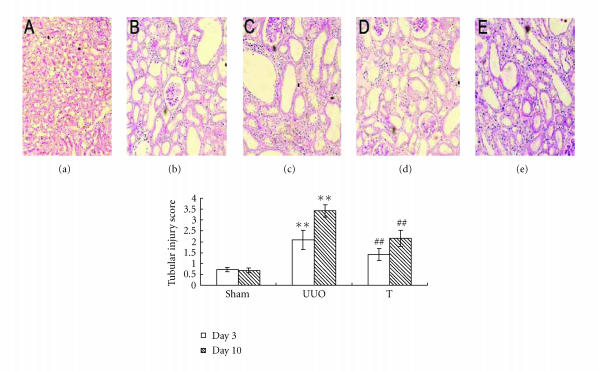
Figure 2.
Tubular injury score at different time points in three groups (×100). Sections were stained with PAS regent. Tubular lesions were graded according to the extent of cortical damage: (a) sham group, (b) UUO on day 3, (c) UUO on day 10, (d) treatment group on day 3, and (e) treatment group on day 10. **: P < .01 versus sham group of the same time point. ##: P < .01 versus UUO group of the same time point.

