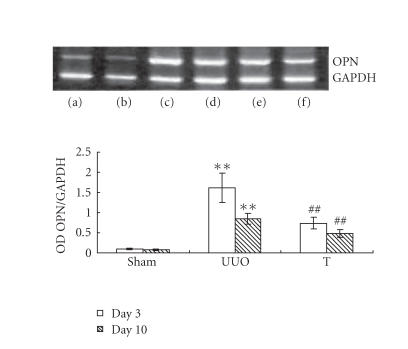
Figure 6.
Expression of OPN at different time points in different groups by RT-PCR. Total RNA was extracted from kidney tissue at the indicated time and reverse-transcribed to cDNA. cDNA was subject to PCR, and OPN was amplified to 418 bp fragments. GAPDH was used as internal control (a) on day 3 in sham group, (b) on day 10 in sham group, (c) on day 3 in UUO group, (d) on day 10 in UUO group, (e) on day 3 in treatment group, and (f) on day 10 in treatment group. **: P < .01 versus sham group of the same time point. ##: P < .01 versus UUO group of the same time point.

