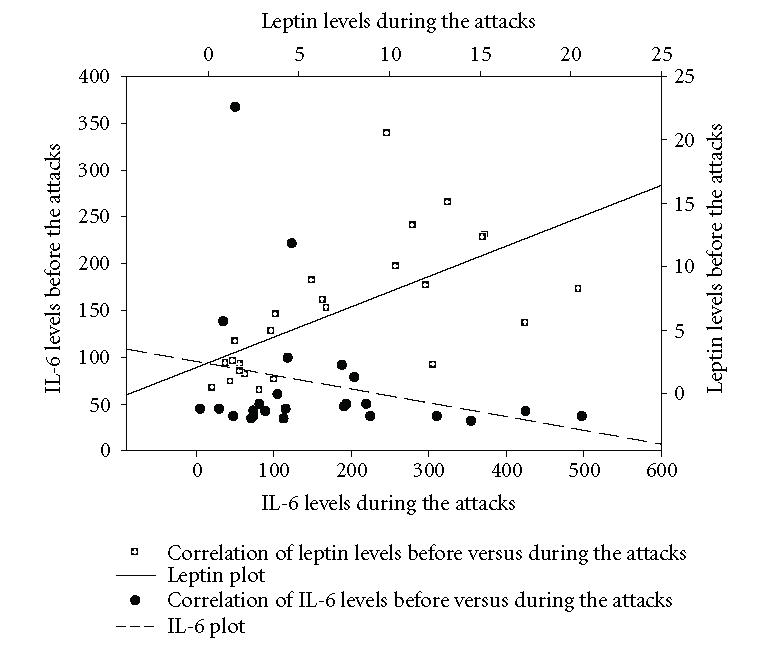
Figure 2.

Correlation plot of leptin before and during FMF attacks together with IL-6 plot. Although serum leptin levels increased to some extent during the attacks, it was not statistical significant (P > .05). Serum IL-6 levels increased from 70.18 ± 14.8 (Mean ± SEM) to 163.32 ± 25.25 (Mean ± SEM) and they were statistically significant (P < .001).
