
Figure 8.
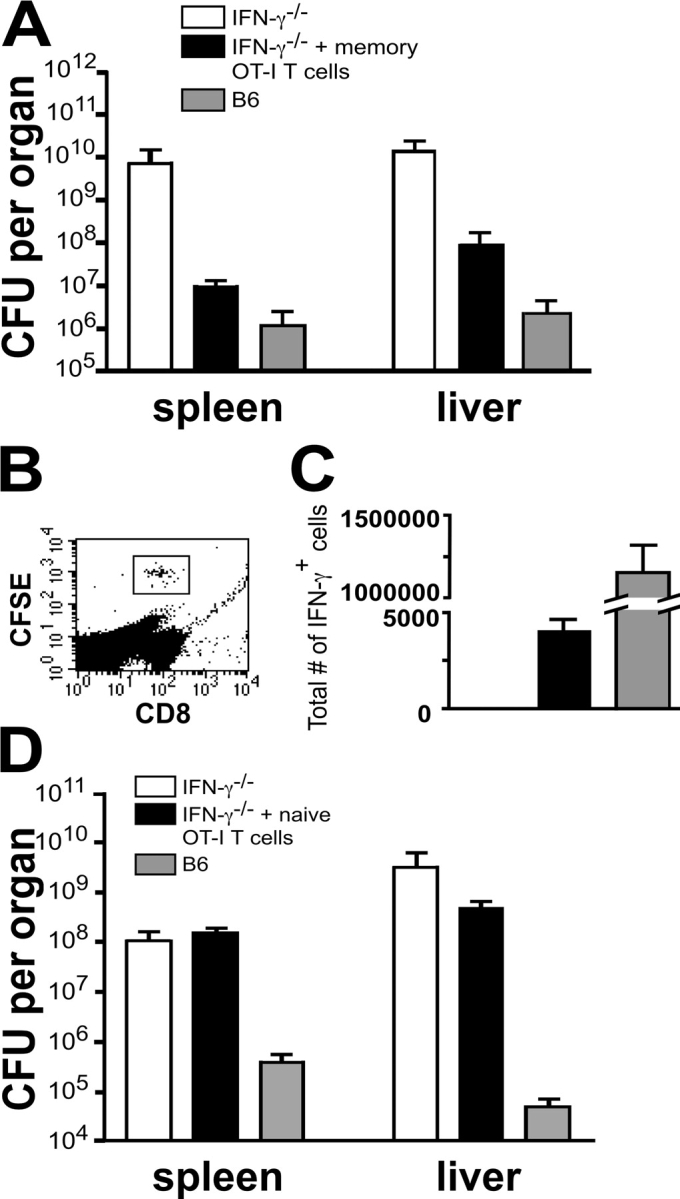
Memory OT-I T cells protect IFN-γ2/2 mice from a WT LM infection. 3 × 10⁶ nylon wool-purified OT-I splenocytes were transferred into B6.Thy1.1 mice and then challenged with 2 × 10⁶ PFU VV/OVA. The mice were then rested for >4 wk, killed, and the splenocytes were sorted for CD8+, Thy1.2+ OT-I T cells. 5 × 10⁵ CFSE labeled memory OT-I T cells were injected into IFN-γ−/− recipients. (A) B6, IFN-γ−/−, and IFN-γ−/− mice transferred with memory OT-I T cells were then infected with ∼104 WT LM and killed 3 d later to determine spleen and liver LM counts. (B and C) Splenocytes from the above mice were cultured for 3 h in media containing GolgiPlug™ and then analyzed for CFSE, CD8, and intracellular IFN-γ expression. The number of IFN-γ–secreting OT-I T cells was calculated by multiplying the total number of splenocytes isolated from the infected mice by the percentage of CFSE-labeled, CD8+, IFN-γ+ cells determined by flow cytometry. The number of IFN-γ–secreting cells in the B6 mice was calculated by multiplying the total number of splenocytes isolated from the infected mice by the percentage of IFN-γ–secreting cells determined by flow cytometry. (D) Naive OT-I T cells were sorted for CD8+, Vα2+, and CD44lo expression. 5 × 10⁵ CFSE-labeled naive OT-I T cells were injected into IFN-γ−/− recipients. B6, IFN-γ−/−, and IFN-γ−/− mice transferred with naive OT-I T cells were then infected with ∼104 WT LM and killed 3 d later to determine spleen and liver LM counts. The data shown are the average of three mice per group for A–C and two mice per group for D. Each experiment is one representative of two.