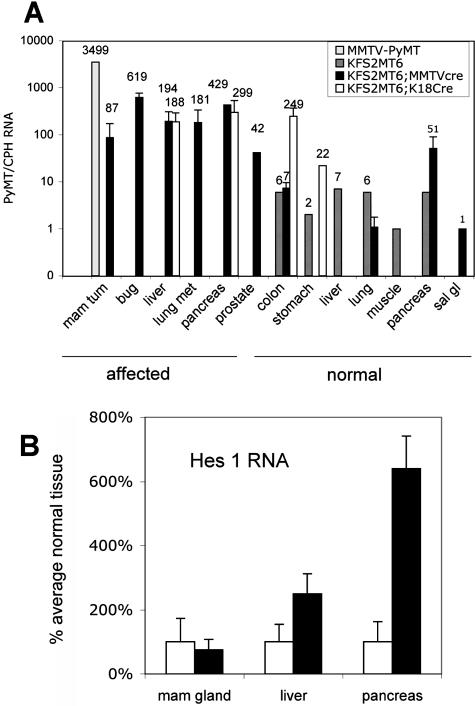
Figure 6.
RNA expression in KFS2MT6 monogenic and bigenic tissues and tumors. A: PyMT RNA levels determined by Q-PCR are normalized to cyclophilin A RNA. MMTV-PyMT indicates average value of two independent mammary tumors. Bug, bulbourethral gland tumors; lung met, single value for a mammary-type tumor found in KFS2MT6; MMTV-Cre7 bigenic mouse lung; mam tum, mammary tumor; sal gl, salivary gland. Average values are shown. Error bars indicate standard deviations of values with three or more tumors. Labels below tissue names indicate appearance of organ at collection. B: Relative Hes1 and cyclophilin A RNA levels were determined by Q-PCR and are displayed relative to normal tissues. Each value represents the average of three to eight samples each from different mice. Filled bars indicate average values for bitransgenic tissues from KFS2MT6; MMTV-cre7 for mammary gland tumors and KFS2MT6; K18CreER animals for pancreatic tumors and livers.

