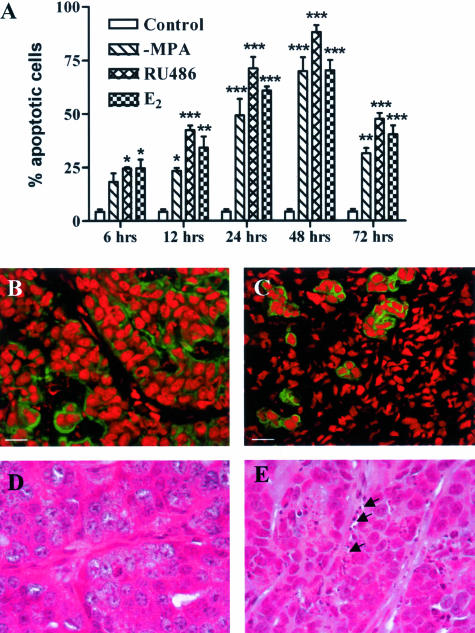
Figure 3.
Loss of keratin-positive cells and increase in the percentage of apoptotic cells with the onset of regression. MPA depot was removed from BALB/c mice bearing the C4-HD tumor, and mice remained untreated (−MPA) or were additionally treated with E2 or RU486 for 6, 12, 24, 48, or 72 hours to induce tumor regression. Tumors were collected, fixed in 10% formalin, embedded in paraffin, and processed according to standard procedures to obtain H&E-stained sections. Apoptotic cells were counted under high magnification as explained in Materials and Methods. A: Number of apoptotic cells expressed as percentage over total number of cells per high-power field. There is a statistically significant increase in the percentage of apoptotic cells compared to the controls as early as 6 hours after the onset of treatments (*P ≤ 0.05, **P ≤ 0.01, ***P ≤ 0.001). B and C: Immunofluorescence for pankeratin in frozen sections derived from control (B) and 72-hour RU486-treated (C) mice. Nuclei are stained with propidium iodide (red) and keratin with the corresponding primary antibody followed by a FITC-conjugated secondary antibody (green). Note the loss of keratin-positive cells in the samples derived from the treated mouse. Similar images were obtained from −MPA- and E2-treated mice. D and E: High-magnification images obtained from H&E-stained sections derived from control (D) and 72-hour RU486-treated (E) mice. Note the presence of apoptotic cells next to the stromal compartment (arrows). The same result was observed by staining sections with the TUNEL reaction kit (not shown). Scale bars, 20 μm. Original magnifications, ×1000 (D, E).

