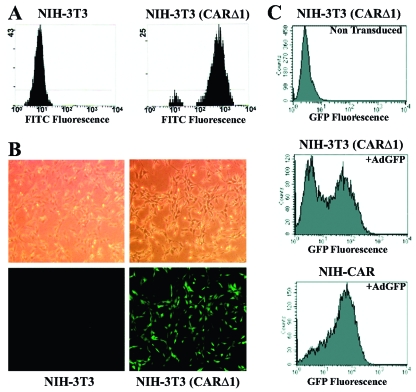
FIG. 1.
Adenoviral delivery in NIH 3T3 fibroblasts. (A) FACS analysis of CARΔ1 expression on the cell surface of NIH 3T3 and NIH 3T3 retrovirally transduced with CARΔ1. Cells were incubated with a primary antibody against CAR and a secondary fluorescein isothiocyanate-conjugated antibody, fixed with formaldehyde, and subjected to FACS analysis. (B) Recombinant AdGFP (55 PFU/cell for 8 h) were used to transduce NIH 3T3 and NIH 3T3 (CARΔ1) cells. Top frames show phase-contrast microscopy. Lower frames show GFP expression visualized by fluorescence microscopy. (C) NIH-CAR cells show homogenous uptake of AdGFP 2 h posttransduction compared to the nonselected mixed population of NIH 3T3 (CARΔ1) cells. Cells were fixed, and GFP expression was determined by FACS analysis.

