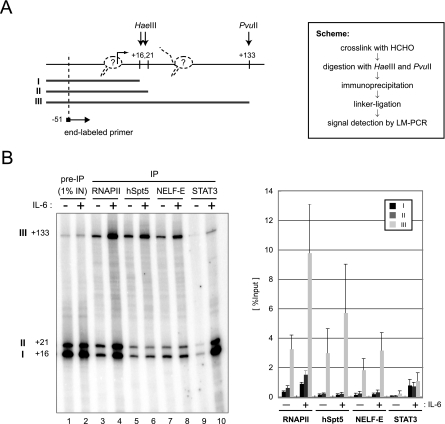
FIG. 2.
Association of RNAPII, DSIF, and NELF with the promoter-proximal transcribed region of junB. (A) Scheme of the assay. At the left, HaeIII and PvuII cleavage sites and the position of the end-labeled primer used to detect LM-PCR products are indicated by arrows. Numbers indicate relative positions from the transcription initiation site, based on the DataBase of Transcriptional Start Sites (http://dbtss.hgc.jp/). Possible positions of RNAPII are also shown (dotted line). At the right, the experimental scheme of the assay is shown. (B) After immunoprecipitation (IP) with the indicated antibodies, coprecipitated DNA was detected by LM-PCR. Numbers at left indicate the positions of cleavage by restriction enzymes. In the graph on the right, the recoveries of fragments I, II, and III are presented as percentages of the input. Signals were quantified with a Storm 860 image analyzer (Amersham Biosciences). Data are the mean ± the standard deviation from three independent experiments.

