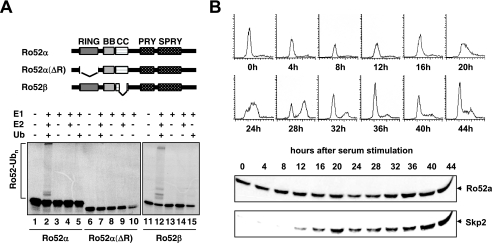
FIG. 2.
Ro52 displays autoubiquitination activity. (A) Autoubiquitination of Ro52. Upper panel, schematic of Ro52 species used in the analysis. Autoradiograms of 35S-labeled Ro52α, Ro52α(ΔR), and Ro52β after in vitro autoubiquitination. −, presence of; +, absence of. (B) T98G cells were arrested in G0/G1 by serum deprivation and stimulated to reenter the cell cycle by the addition of serum. At the indicated times thereafter, whole-cell extracts were prepared, equalized for protein content, and processed for immunoblotting using antibodies against the indicated proteins (lower panel). In parallel, aliquots of cells were processed for FACS analysis to determine cell cycle distribution (upper panel).

