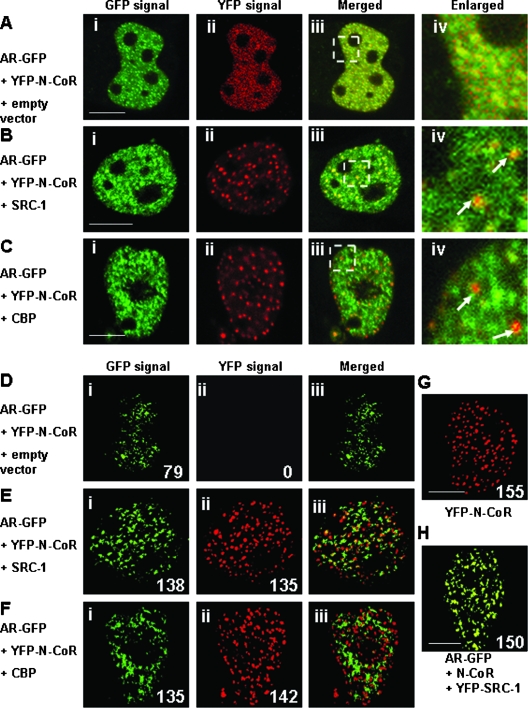
FIG. 13.
The two- and three-dimensional image analyses of the effects of YFP-N-CoRs and coactivators on the intranuclear focus formation of agonist-bound ARs. COS-7 cells were cotransfected with the expression plasmids for AR-GFP and YFP-N-CoR together with the empty vector (A and D), nonfluorescent SRC-1 (B and E), or CBP (C and F). The molar ratio of transfected amounts of expression plasmids for these three proteins was 1:3:10. The cells were also transfected with the expression vectors for YFP-N-CoR alone (G), or AR-GFP and YFP-SRC-1 together with nonfluorescent N-CoR (H), and the transfected amounts were the same as those in panels B. Images were then collected in the presence of 10 nM DHT. Signals from AR-GFP (green, i) and YFP-N-CoR (red, ii) were obtained under the microscope, and the two signals were merged (iii) in panels A to F. (A to C) Two-dimensional image analyses. The area indicated in the white rectangle in panel iii is magnified as shown in panel iv. The white arrows indicate the intranuclear discrete dots in red, which were derived from YFP-N-CoR. (D to F) Three-dimensional image analyses. The confocal images of the nuclei in living cells were collected to reconstruct three-dimensional images. The merged images were displayed as surface views on the z axis. (G) Three-dimensional image for YFP-N-CoR. (H) Three-dimensional image for AR-GFP and YFP-SRC-1 coexpressed with nonfluorescent N-CoR. The merged images were displayed as a surface view on the z axis. The number of AR-GFP foci or YFP-N-CoR dots was indicated in each panel. The number of discrete dots of YFP-N-CoR was 155 ± 46 (n = 10). Bars, 5 μm.

