FIG. 2.
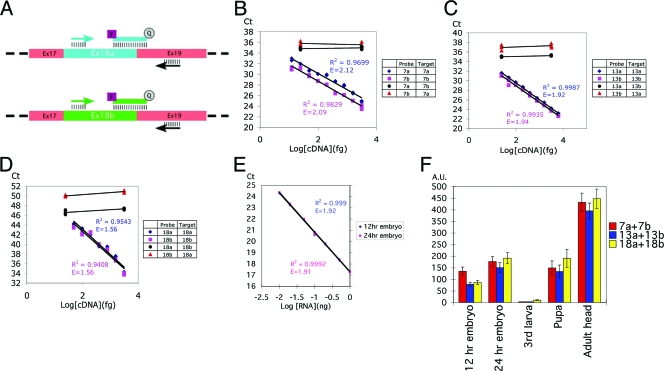
TaqMan-based real-time PCR analysis provides an accurate measurement of the expression levels of the CadN alternative exons. (A) A schematic for primer and probe design is shown for exons 18a and 18b. Each assay used one alternative-exon-specific probe (blue or green line), one alternative-exon-specific primer (blue or green arrow), and one common primer (black arrows). In order to ensure target specificity, the TaqMan probes were designed to match the exon-exon boundary. Common exons 17 and 19 are shown in pink boxes, and alternative exons 18a and 18b in a blue or green box, respectively. (B to D). Standard curves and cross-reactivity tests for exons 7a/7b, 13a/13b, and 18a/18b, respectively. The accuracy and specificity of the TaqMan probes were tested using the cDNAs of the CadN isoform 7b-13a-18a or 7a-13b-18b in control amounts (as indicated). The x axis represents the logarithm of the input cDNA; the y axis represents the number of PCR cycles required to reach a given fluorescent signal level (Ct). When the probes were tested against their cognate target cDNAs (blue rhomboids and red squares), an inverse linear relationship between Ct and the logarithm of the input cDNA was observed over a range of 10 to 3,000 fg of CadN cDNA. Cross-reactivity, tested using TaqMan probes with their noncognate targets (blue discs and red triangles), was found to be minimal. Standard linear regression analysis was performed to calculate the standard curve, the coefficient of determination (R2), and PCR efficiency (E) (as indicated). The standard curves were used to calculate the experimental data (Fig. 3) by interpolation. (E) The standard curve for the internal control, 18S rRNA. Experiments were performed as for panels A to C except that embryo cDNAs were used as the target. (F) The CadN expression levels at different developmental stages were normalized using 18S rRNA as an internal reference (E). The sums of the expression levels of the CadN alternative exons 7a/7b, 13a/13b, and 18a/18b are shown as red, blue, and yellow bars, respectively. The x axis represents the developmental stages; the y axis represents CadN expression levels in an arbitrary unit (A.U.) with respect to the 18S rRNA level in the same sample.

