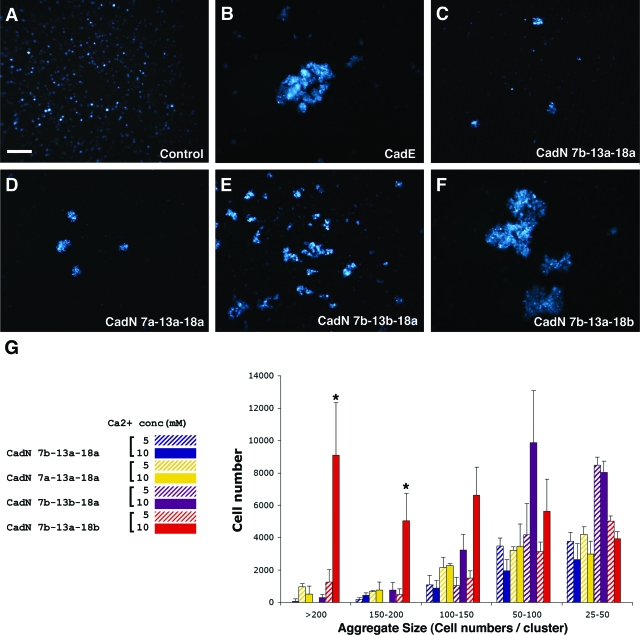
FIG. 4.
CadN isoforms mediate graded homophilic interactions. S2 cells coexpressing a GFP marker and CadE (E-cadherin) or different CadN isoforms were assessed for their abilities to induce cell aggregation (see Materials and Methods for details). (A to F). Representative images of cell aggregates induced by the expression of CadN isoforms or CadE and the addition of 10 mM of calcium. (A) GFP as a negative control; (B) CadE as a positive control; (C to F) CadN isoforms as indicated. Scale bar: 100 μm. (G) A bar chart of the size of cell aggregates formed by S2 cells expressing different CadN isoforms in the presence of 5 (striped bars) or 10 (solid bars) mM of calcium. Cell aggregates are divided into five categories according to the number of cells in each aggregate. The x axis represents the cell aggregate size (25 to 50, 50 to 100, 100 to 150, 150 to 200, and greater than 200 cells per cell cluster). The y axis represents the total number of cells that form a given range of cell cluster size. The bars indicate the means of three independent results. The error bars indicate the standard error. *, P < 0.005.

