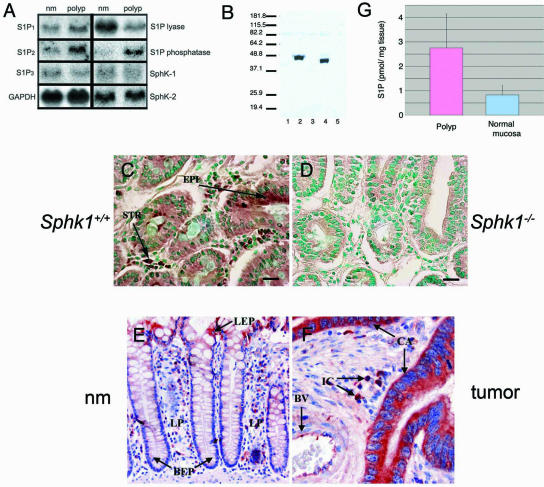
FIG. 1.
Expression of S1P receptors, Sphk1, and sphingolipid metabolic enzymes in intestinal tissues. (A) Northern blot analysis of S1P receptors and sphingolipid metabolic enzymes. nm, normal mucosa. Data show a representative blot from two to four animals that was repeated at least twice. (B) Immunoblot analysis of mouse and human Sphk1 in HEK-293T cells with anti-Sphk1 antiserum. Lanes: 1, mock; 2, mouse Sphk1; 3, mouse Sphk2; 4, human Sphk1; 5, human Sphk2. (C) Expression of Sphk1 in the polyp tissue of an ApcMin/+ Sphk1+/+ mouse (brown) is seen in epithelial and stromal cells. EPI, epithelial cells; STR, stromal cells. (D) Control staining of Sphk1 in the polyp tissue of an ApcMin/+ Sphk1−/− mouse. Scale bar, 10 μm in panels C and D. The counterstain in panels C and D is methyl green. (E) Expression of Sphk1 in normal colonic mucosal tissue adjacent to the colon cancer (red). (F) Expression of Sphk1 in human colonic mucosa and in colon cancer (red). BEP, basal epithelial cells; LP, lamina propria; LEP, luminal epithelial cells; CA, cancer cells; BV, blood vessel; IC, stromal mononuclear inflammatory cells; EP, epithelial cells. Original magnification is ×200 for panel E and ×400 for panel F. Sections in panels E and F are counterstained with hematoxylin and eosin (H&E). (G) S1P levels in the adenoma and the normal mucosa of an ApcMin/+ Sphk1+/+ mouse were quantified by HPLC methodology as described in the text. Data (mean ± standard deviation [SD]) were derived from three animals.

