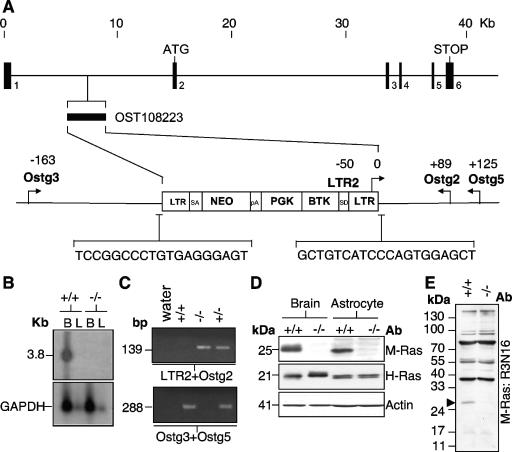
FIG. 3.
Generation of the M-Ras null mouse. (A) The retroviral integration site within the first intron of the mouse MRas gene in the ES cell clone, OST108223, is indicated. The nucleotide sequences flanking the insertion site are shown. The locations of the PCR primers (LTR2, Ostg2, Ostg3, and Ostg5) used in genotyping are indicated. Their positions (in base pairs) relative to the sites of integration are shown (not drawn to scale). (B) Poly(A)+ RNA extracted from the brain and liver of Mras+/+ and Mras−/− mice were analyzed with an M-Ras cDNA probe (upper panel). Loading control was provided by a GAPDH probe (lower panel). (C) A typical genotyping analysis showing the 139- and 288-bp PCR fragments specific for the Mras−/− and Mras+/+ alleles, respectively. (D) The expression of M-Ras was completely absent in both brain and astrocyte lysates derived from Mras−/− mice (upper panel). The levels of H-Ras are, however, not significantly altered (lower panel). (E) The lack of expression of M-Ras was further confirmed with an anti-M-Ras polyclonal antibody, R3N16, raised against the N terminus of M-Ras (solid arrowhead). The multiple bands of >30 kDa in size are likely due to nonspecific cross-reactivity.

