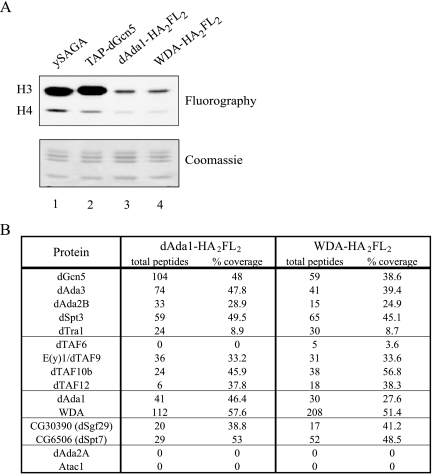
FIG. 4.
Affinity purification and MudPIT analysis of dSAGA. (A) The nucleosomal HAT activity of affinity-purified dSAGA complexes (lanes 2 and 3) was compared to the HAT pattern of yeast SAGA (ySAGA) and dGcn5-containing complexes purified from cells expressing TAP-dGcn5 (TAP-dGcn5). The fluorography is shown above the Coomassie gel. (B) MudPIT analysis of dSAGA, purified from cells expressing tagged dAda1 or WDA. The table shows the number of nonredundant spectra for each protein (total peptides) and the amino acid sequence coverage (% coverage).

