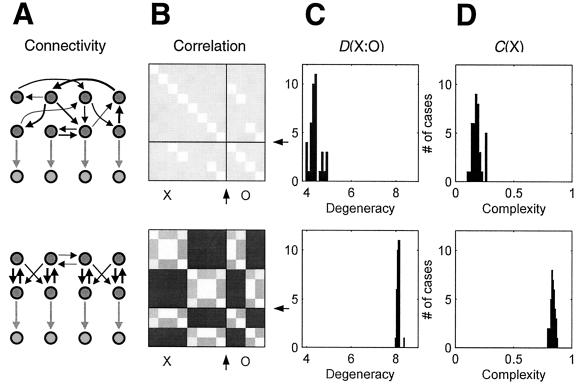
Figure 5.
Typical results obtained from simulations of 40 systems of eight units connected to an output sheet of four units; during optimization the system’s connectivity was modified by gradient ascent to increase degeneracy D(X;O) (Eq. 5) with respect to a fixed output pattern. This output was given as a correlation matrix of the units of the output sheet. In the results shown, the output consisted of a high cross-correlation (0.75) among pairs of two units of the output and a low cross-correlation (0.25) between them. (Top) Data obtained from one example of a randomly connected system before the beginning of the runs. (Bottom) Data from one example obtained after gradient ascent resulted in a stable value for degeneracy. (A) Schematic representations of graphs showing the interconnections between units of the system and the output. (B) Correlation matrices (conventions as in Fig. 4B). (C) Distribution of values for degeneracy D(X;O) (see Eq. 5) for 40 randomly chosen (Top) and optimized (Bottom) systems. (D) Distribution of values for complexity C(X) for the corresponding systems.

