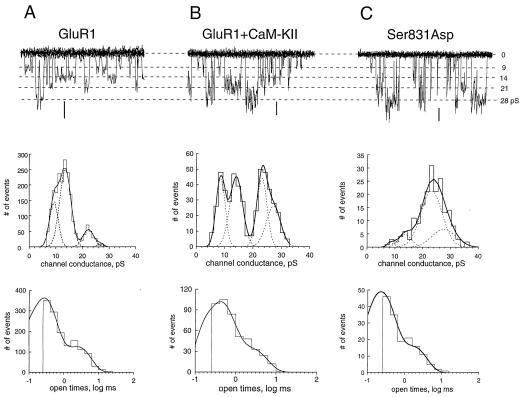
Figure 4.
CaM-KII increased the contribution of high-conductance states in single-channel activity. Single-channel recordings (Top), distribution of channel conductances (Middle), and channel openings (Bottom) were obtained from cells expressing GluR1 alone (A), from cells expressing GluR1 coexpressed with CaM-KII (B), or from the Ser-831-to-Asp mutant (C). For single-channel recordings, eight traces every 100 ms were superimposed, recorded at membrane potentials of −101 mV (A), −128 mV (B), and −125 mV (C). For comparison, currents in A–C were scaled by conductance and show the same four conductance states in all situations. Note the different scales for the same calibration of 1 pA in A–C. Each conductance histogram was fitted by the sum of four Gaussian functions (smooth curves), which are shown individually by dotted lines. Their mean values were, for A, 9.3 pS (contribution of 26.8%), 13.5 pS (56.8%), 22.2 pS (12.4%), and 27.3 pS (4%); for B, 8.6 pS (23.7%), 14.1 pS (30.3%), 23.1 pS (24%), and 27.1 (22%); and, for C, 9.6 pS (0.8%), 13.1 pS (13.7%), 21.3 pS (57.5%), and 26.1 pS (28%). Calculated weighted single-channel conductances were 13.8 pS (A), 17.9 pS (B), and 21.4 pS (C). Each distribution of open times was fitted by the sum of two exponentials with time constants of 0.24 ms (contribution of 73%) and 2.4 ms (A), 0.36 ms (71%) and 2.4 ms (B), and 0.29 ms (52%) and 2.5 ms (C).

