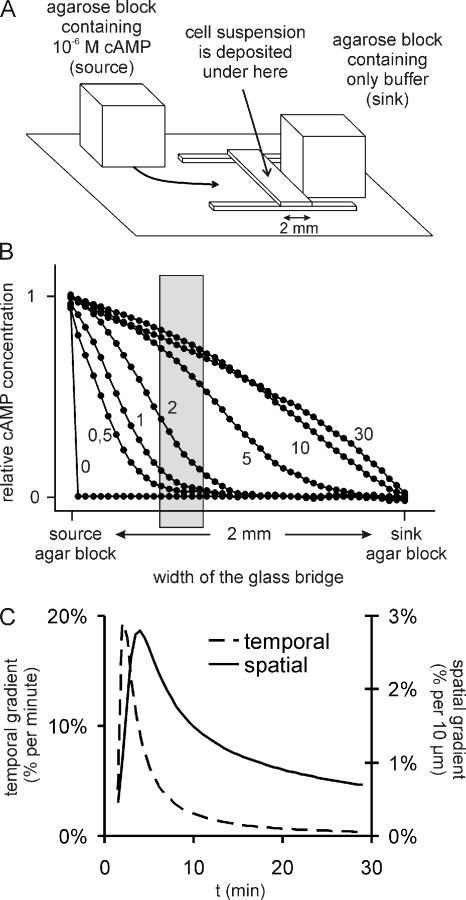
Figure 2.
Chemotaxis setup and gradient formation. (A) Schematic drawing of the chemotaxis setup modeled after the Zigmond chamber. A droplet of cell suspension is deposited underneath the central glass bridge. An agarose block containing only buffer (sink) is placed on one side and an agarose block containing 10−6 M cAMP (source) is placed on the opposite side of the bridge. A cAMP gradient is formed across the bridge by diffusion of the cAMP from the source to the sink. (B) The formation of the cAMP gradient was deduced by measuring the diffusion across the bridge of bromophenol blue, a dye with a molecular weight similar to that of cAMP. The distribution of dye concentration across the bridge is plotted for different time points (indicated in minutes next to the graphs) after initialization of the gradient. Chemotaxis of cells is observed in an area of 350 × 270 μm at a distance of 700 μm from the source; this area is indicated by the gray box. (C) Deduced time course of the temporal and spatial cAMP gradients in the center of the area indicated by the gray box in Figure 3B. The temporal gradient is expressed as the percentage cAMP concentration increase per minute. The spatial gradient is expressed as the percentage cAMP concentration difference across 10 μm, which equals approximately the length of a Dictyostelium cell.

