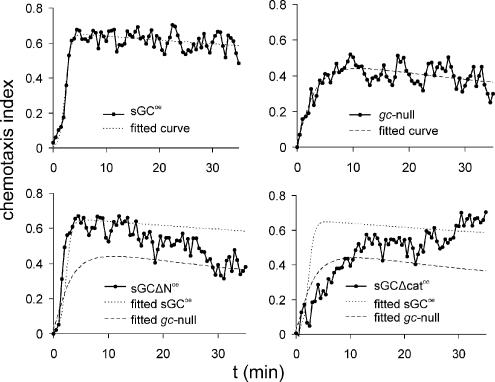
Figure 3.
Chemotaxis efficiency of the sGC mutants. The chemotaxis efficiency of mutant sGC cell strains in the modified Zigmond chemotaxis chamber is plotted during the course of gradient formation. Cells experience both a spatial and a temporal gradient during the first 10 min, but the temporal component is slowly lost and a stable spatial gradient remains during the last 20 min. To facilitate comparison between the different cell strains, the fitted curve of the chemotaxis response of sGCoe cells (dotted line) and gc-null cells (dashed line) were included in the graphs of sGCΔNoe and sGCΔcatoe cells.

