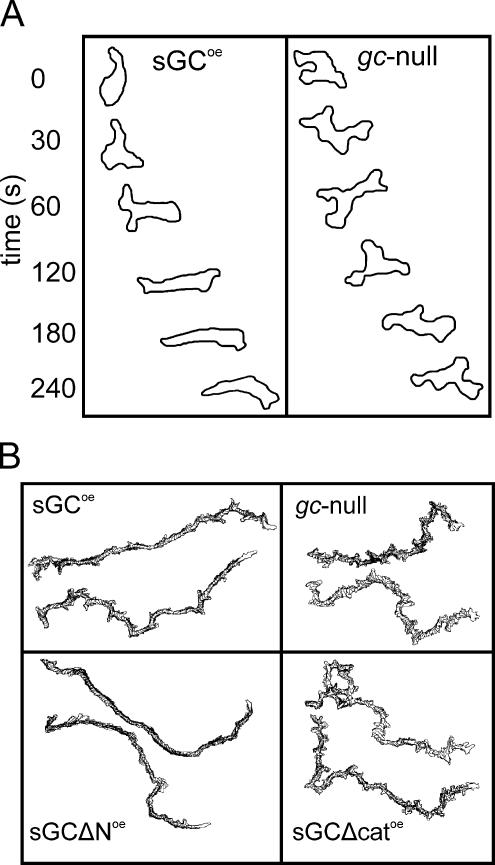
Figure 4.
Cell shape of the sGC mutants during aggregation. (A) The contours of a representative sGCoe cell and gc-null cell during the spatiotemporal phase of the cAMP gradient. The top frame was taken ∼1 min after placing the agarose block with cAMP adjacent to the bridge, which is the time point when the cAMP wave arrives at the cell. Subsequent frames are depicted from top to bottom and were taken at indicated intervals. (B) The contour of each cell was determined every 30 s during chemotaxis of the sGC mutants in the modified Zigmond chamber. A stack of contours spanning at least 25 min of two representative cells of each strain is shown.

