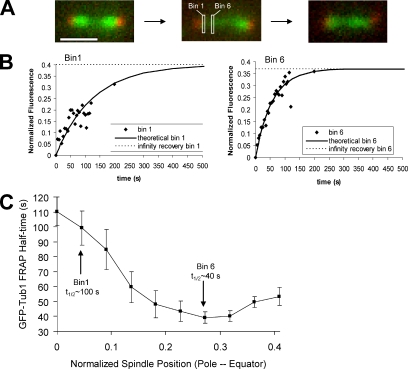
Figure 2.
Spindle microtubules exhibit a spatial gradient in tubulin turnover rate. (A) Experimental images of the GFP tubulin FRAP experiment (SPB, red; MTs, green). Experimental fluorescence recovery was monitored in ∼65-nm “bins” along the photobleached half of the mitotic spindle (white boxes are unscaled representative bins). Scale bar, 1000 nm. (B) Representative raw experimental data from a bin near the SPB (left, bin1), and a bin midway between the spindle equator and the SPB (right, bin 6). Theoretical exponential fit curves calculated based on bin experimental recovery half-times are drawn through each plot (solid line). (C) Quantitative experimental results for GFP-tubulin FRAP half-time by spindle location. Normalized spindle position 0 represents the bin nearest the SPB, whereas normalized spindle position 0.45 represents the bin near the spindle equator. FRAP was most rapid at spindle positions midway between the spindle equator and each SPB, where plus-ends were clustered in the metaphase spindle (∼bin 6).

