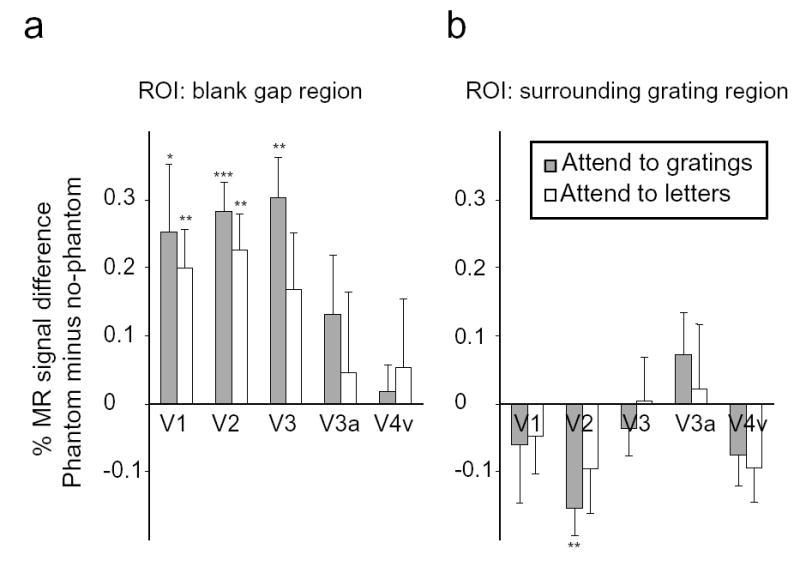
Figure 3.

Magnitude of responses to visual phantoms in retinotopic regions corresponding to the blank gap (a) and the surrounding gratings (b). Ordinate axis shows the difference in fMRI activity levels for the vertical phantom condition minus the horizontal no-phantom condition. Gray bars indicate attention to peripheral gratings; white bars indicate attention to central letters. Error bars denote standard error of the mean across subjects. Significant differences in fMRI activity between the vertical phantom and horizontal control conditions are indicated (* P < 0.05; ** P < 0.01; *** P < 0.001).
