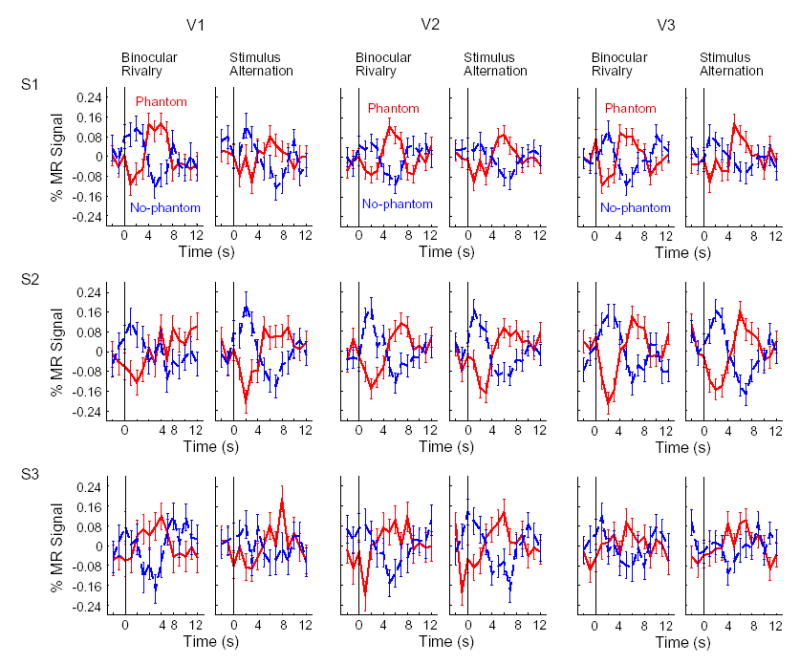
Figure 5.

Event-related activity for reported percepts of phantom (black solid lines) and no-phantom (gray dashed lines) during rivalry and stimulus alternation. Average time courses show activity corresponding to the blank gap in areas V1–V3 for all 3 subjects (error bars, ±1 s.e.m.). Activity corresponding specifically to the blank gap was measured based on the difference in fMRI activity for the blank gap region minus the surrounding region. Vertical lines at time 0 s indicate when the subject reported seeing a phantom or no phantom.
