
Figure 2. Expression levels of ICAM-1 are different between control and TNF-α treated arterioles and venules.
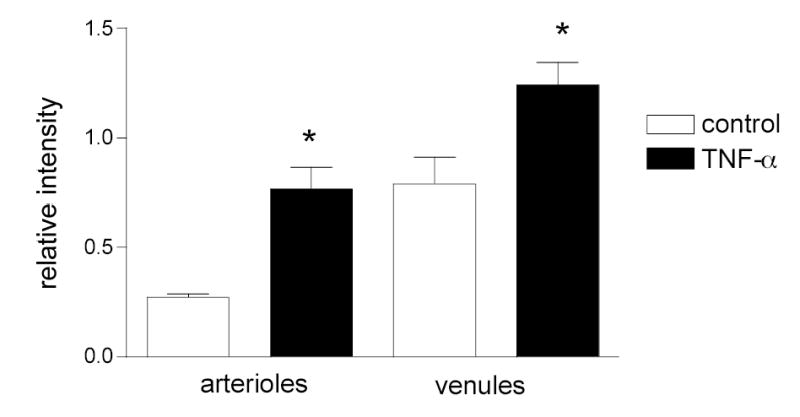
Both arteriolar and venular ECs express ICAM-1 under control conditions and its levels significantly increase following TNF-α treatment. ECs were labeled for ICAM-1. Average fluorescence intensity of ECs was obtained for both control and TNF-α treated mice. The intensity was normalized to FITC-dextran and the background noise was subtracted. N= 40 cells for each group.
* significantly different from the appropriate control group (Anova, p<0.01). There is no significant difference between columns 2 and 3.