
Figure 3. ICAM-1 distribution on the vessel wall is not uniform.
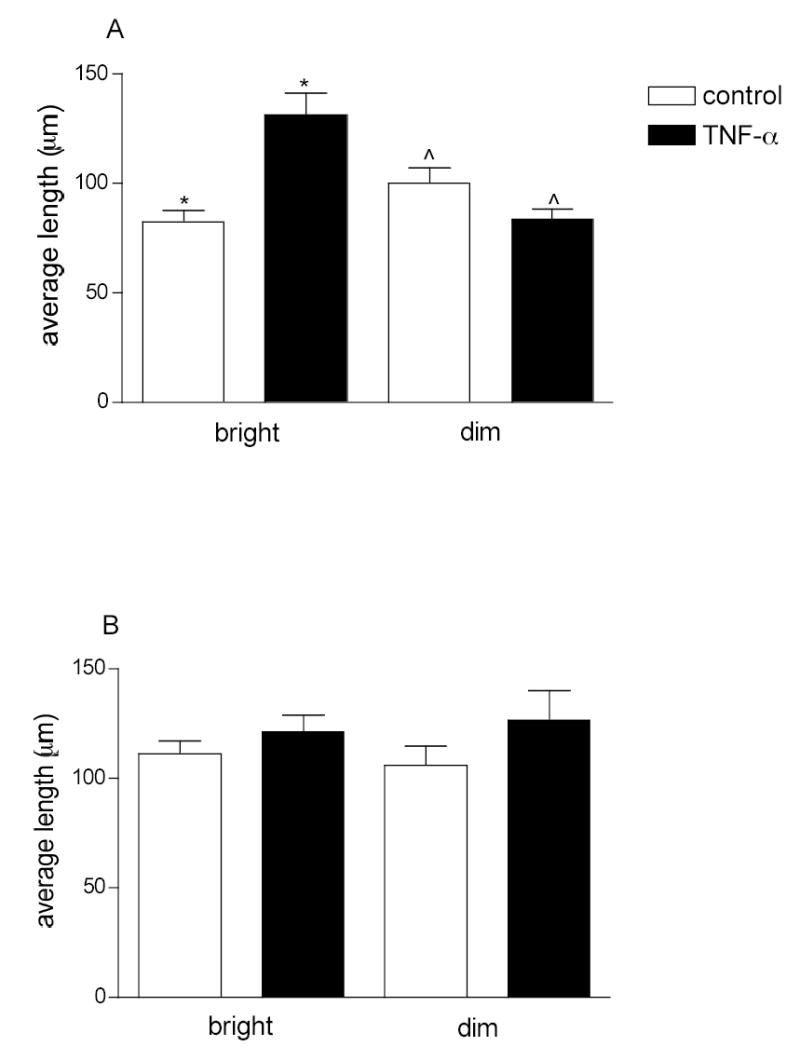
Arterioles (A) and venules (B) were labeled for ICAM-1. Fluorescence intensity along the vessel wall was quantified and pooled into bright and dim regions using predetermined criteria (see Methods). The data are presented as average lengths of sampled bright and dim regions (n=10–12 vessels). Length distribution was normalized to the total sampled length of the vessel. TNF-α treatment significantly increased the average length of the bright regions in arterioles but it had no effect on the average lengths of either bright or dim regions in venules.
*, ^ significantly different from each other (Anova, p<0.01).