
Figure 6. ICAM-1 expression between adjacent ECs in arterioles but not in venules is significantly different following TNF-α.
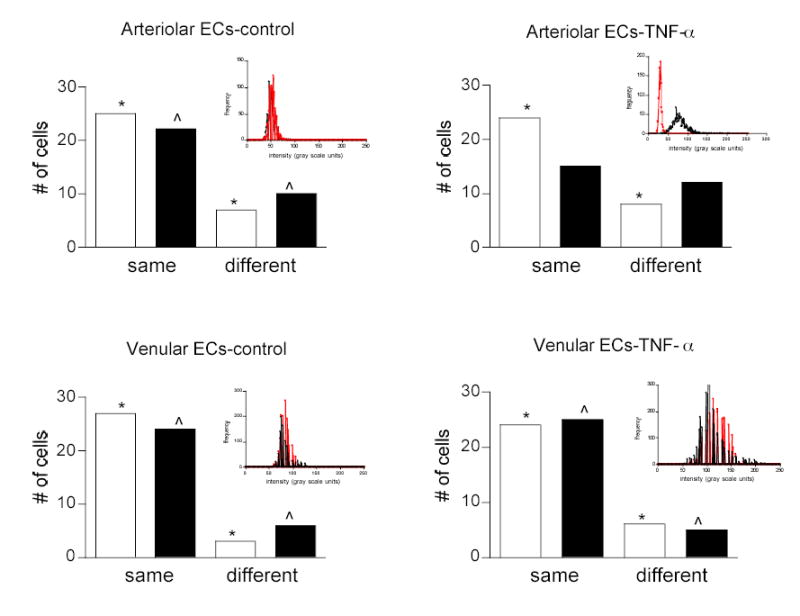
Arterioles and venules were labeled for ICAM-1. Adjacent pairs of ECs (black bars) were sampled and their average fluorescent intensity was quantified and compared. To establish the extent to which adjacent cells could have the same intensity due to random chance, individual ECs were sampled from throughout the tissue, randomly paired (white bars) and their average fluorescence was measured. Cells with intensities within 2 standard deviations were considered to be the same, otherwise they were labeled as different. Following TNF-α treatment, in arterioles but not in venules a different population of ECs was activated resulting in a greater number of adjacent ECs expressing different levels of ICAM-1 *, ^ - mean fluorescence intensity of the cells in each indicated group is significantly different (P < 0.05). Inset are histograms of intensity distribution for a typical pair (one red, one black) of adjacent ECs for each group. Note that in controls, the histograms for the cell pair overlap in both arterioles and venules, whereas following TNF-α treatment in arterioles one cell decreased and one cell increased its ICAM-1 expression compared to venules where both cells increased their ICAM-1 expression.