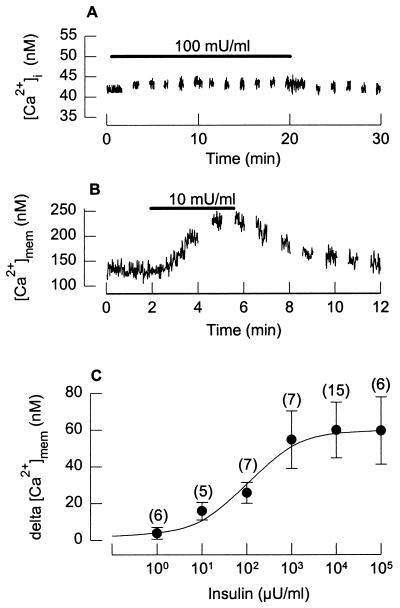
Figure 2.
Insulin increases calcium only near the membrane. (A) Global [Ca2+]i (measured with Indo-1) shows little change when insulin is applied (indicated by solid bar). (B) [Ca2+]mem (measured with FIP18) increases when insulin is applied (shown by solid bar). Gaps in records A and B are when light was switched off to avoid bleaching of the dye. (C) Insulin dose–effect curve showing the increase in near-membrane calcium when increasing concentrations of insulin were applied. Values are means ± SEM, and the number of fibers is indicated for each point. The curve was drawn by fitting a sigmoidal function to the data points.

