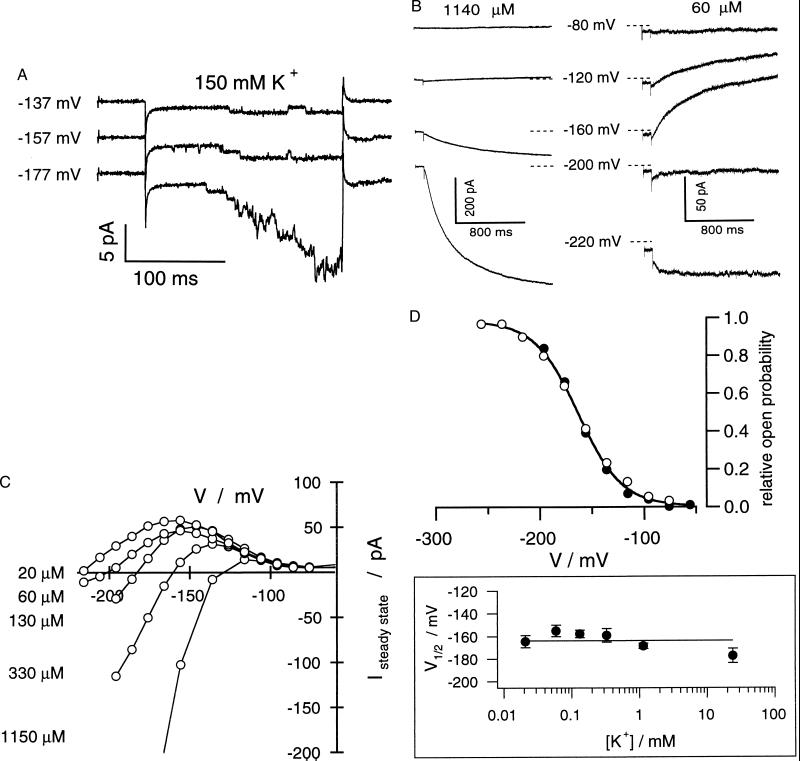
Figure 2.
Voltage-, time-, and K+-dependent properties of the K+ uptake channel in A. thaliana guard cells. (A) Activation of single K+ uptake channels in an outside-out patch in response to hyperpolarizing voltage pulses to values indicated starting from a holding potential of –67 mV. For better resolution of current amplitudes, the K+ concentration was 150 mM K+ on both sides. The current–voltage relation of single channels from four to six individual measurements as a function of the membrane voltage corresponded to a slope conductance of 8.6 ± 0.3 pS (not shown). (B) Macroscopic outward and inward K+ currents (whole-cell configuration) through the inward rectifier elicited by 1.5-s, too pulses to voltages indicated in the presence of 1140 μM K+ (Left) and 60 μM K+ (Right). Because of the experimental conditions Kout+ channels present in the plasma membrane, too, are not active in the voltage range shown. (C) Current–voltage curves of steady-state K+ currents in the presence of different external K+ concentrations. Pulse protocols are as in B. The data shown in B and C are representative of three to six independent experiments. (D) Voltage-dependent open probabilities (Upper) and half-activation potentials (V1/2, Lower) as a function of the K+ concentration. Open probabilities were recorded in the presence of 30 mM (Upper, ○) and 20 μM K+ (Upper, ●) and 20, 60, 130, 330, and 1,140 μM K+ (Lower, n = 3–9).

