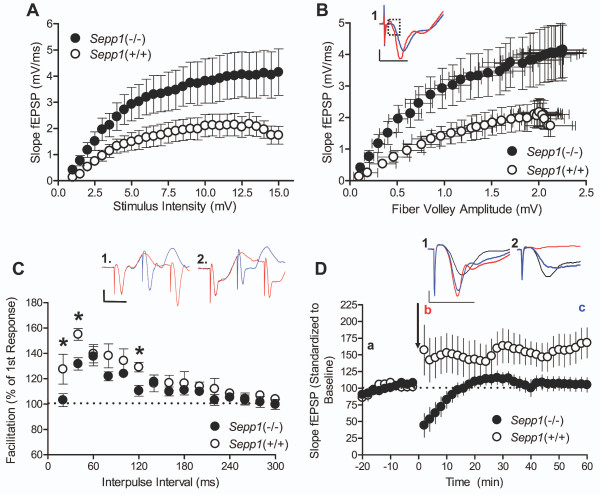
Figure 5.
Sepp1(-/-) mice exhibit enhanced synaptic transmission and severe synaptic placticity defects. (A) Input-output relationship of the slope of the CA1 field excitatory postsynaptic potential (fEPSP) in response to increasing stimulation of the Schaffer collateral fibers. Slices obtained from Sepp1(-/-) mice exhibit greater evoked fEPSP slopes than wild type controls (Sepp1(-/-) n = 12, Sepp1(+/+) n = 8). Nonlinear regression zero to top analysis confirms that the curves are different (p < 0.0001). (B) Relationship between the slope of the evoked fEPSPs from panel A and the corresponding fiber volley amplitude. Sepp1(-/-) slices exhibit a greater postsynaptic response than wild type slices to similar presynaptic depolarization. Nonlinear regression zero to top analysis confirms that the curves are different, p < 0.0001) Inset: Representative traces of half the maximum fEPSP slope show a greater fEPSP slope for Sepp1(-/-) slices (red) compared to wild type slices (blue) despite similar fiber volley amplitudes (dashed box). (C) Percent paired-pulse facilitation (PPF) achieved with increasing inter-pulse intervals. Sepp1(-/-) slices have significantly reduced PPF at 20, 40 and 120 ms inter-pulse intervals (Sepp1(-/-) n = 12, Sepp1(+/+) n = 8; 20 ms *p = 0.04, 40 ms *p = 0.03, 120 ms *p = 0.01). Inset: Representative PPF traces at 20 ms (blue) and 40 ms (red) inter-pulse intervals from (1) Sepp1(+/+) slices and (2) Sepp1(-/-) slices. (D) Long-term potentiation induced by high frequency stimulation (HFS: 100 Hz, 1 sec × 2, 20 sec interval). Sepp1(-/-) slices fail to potentiate following HFS (Sepp1(-/-) n = 12, Sepp1(+/+) n = 8; ANOVA p < 0.0001). Inset: Representative traces from (1) Sepp1(+/+) slices and (2) Sepp1(-/-) slices at time pints a, b and c (a: black-first baseline recording, b: red-2 min post HFS, c: blue-60 min post HFS). All trace scale bars are 1 mV by 10 ms.

