
Figure 5.
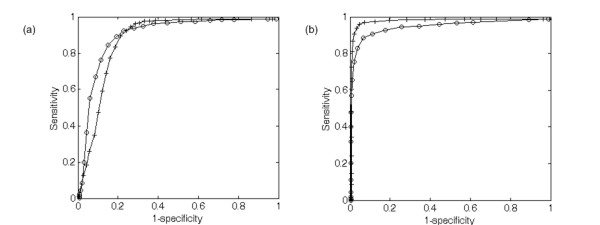
Comparisons between a random negative data set and an original negative data set. (a) The plots show the performance of the original (circle) and random (plus) classifiers on the original test data set. (b) The plots show the performance of the original (circle) and random (plus) classifiers on the random test data sets.