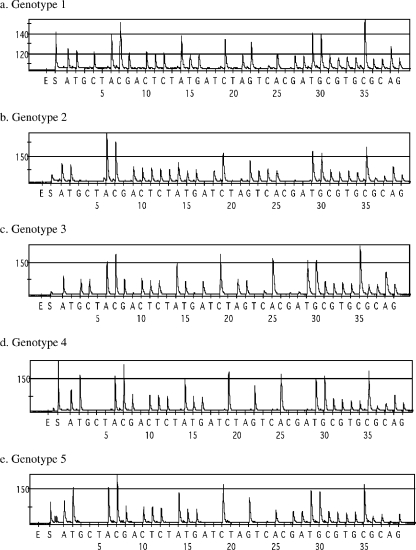
FIG. 2.
Characteristic pyrogram traces generated from 5′NCR of HCV belonging to different genotypes. The y axis shows signal intensity in arbitrary light units, and the x axis shows temporal dispensation of nucleotides in minutes. E, dispensation of enzyme mix. S, dispensation of lumogenic substrate.

