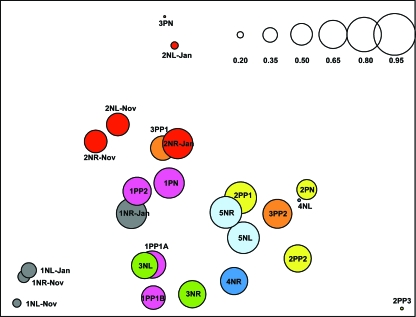
FIG. 5.
Scatterplot of the first two orthogonal principal axes based on the sample dissimilarity matrix. The samples from each subject are represented with the same color, and the sizes of the circles are proportional to the sample diversity, as determined by Rao's analysis. The diversity scale is shown in the upper right corner.

