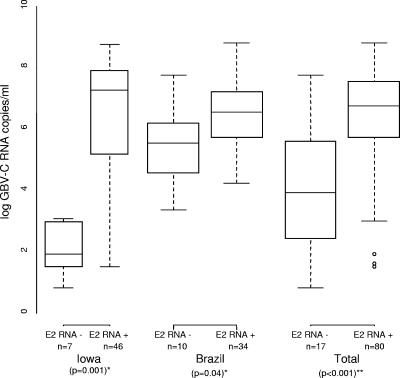
FIG. 4.
Relationship between baseline log10 GBV-C RNA copies/ml and detection by RT-PCR using the E2 primer set. The subjects were those who were GBV-C RNA positive by the GS definition and for whom log10 GBV-C RNA was available (n = 97). A value of 0.5 log10 (1,000) was imputed for 1 Brazil and 18 Iowa subjects whose GBV-C RNAs were below the lower limit of detection (*, P values from two-sample t test, for each study; **, P value adjusted for study). Each box is between the upper and lower quartile, with the bar denoting the median. The whiskers represent the largest and smallest datum points.

