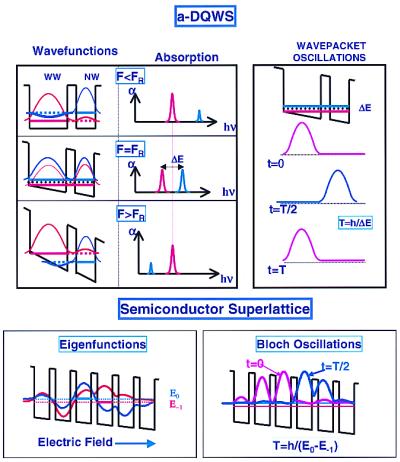
Figure 2.

(Upper) Schematic representation of the energy levels, wavefunctions, and wavepacket oscillations in a-DQWS. (Left) a-DQWS for three different bias values; FR is the field at which the two lowest electron levels are in resonance. The schematic absorption spectra are shown on the right. (Right) Wavepacket oscillations when a spectrally broad ultrashort pulse excited the wavepacket in the WW. (Lower) Semiconductor superlattice. (Left) Schematic diagram of the two lowest electron energy levels and their eigenfunctions. (Right) Bloch oscillations in the superlattice when the wavepacket is initially excited in well 0, the third well from the left.
