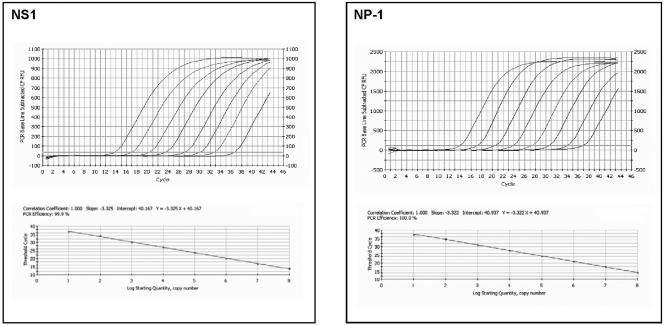
FIG. 1.
NS1 and NP-1 real-time PCR assays showing representative results obtained with serial 10-fold dilutions (101 to 108 copies per reaction) of the pCRII HBoV plasmid. The top panels show baseline subtractive curve fit views of the data with relative fluorescence units (RFU) plotted against cycle number. The default setting of 10 times the standard deviation of the RFU measured in all wells over the baseline cycles was used to calculate the CT for a positive reaction (horizontal line). The bottom panels show standard curve analysis of the DNA amplification plots with CT values plotted proportionately against the logarithm of the input copy number. The dynamic range of NS1 and NP-1 PCR assays spans 8 log units with slopes of −3.3 and an R2 value of 1.0.

