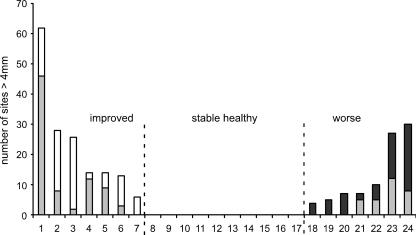
FIG. 1.
Clinical stability of 24 subjects over 2 years. For the improved group, the shaded and open bars taken together indicate the number of sites with probe depths of >4 mm (deep sites) at baseline. Open bars represent decreases in the number of deep sites that occurred between the baseline and final sampling times. For the worse group, the shaded bars indicate initial clinical status and the solid bars represent increases in the number of deep sites that occurred between the baseline and final sampling times.

